


Table of contents
- TAM vs SAM vs SOM: How to Calculate Your Real Market Opportunity
- What Do TAM, SAM and SOM Stand For?
- TAM vs SAM vs SOM in Simple Words
- TAM: What Is Total Addressable Market?
- TAM Is a Ceiling, Not a Revenue Forecast
- What Should Be Included in TAM?
- TAM Example: SaaS
- TAM Example: Consumer Product
- SAM: What Is Serviceable Addressable Market?
- SAM Formula
- Why TAM and SAM Can Be Very Different
- What Can Reduce TAM Into SAM?
- SAM Example: Egyptian SaaS Company
- SOM: What Is Serviceable Obtainable Market?
- SOM Formula
- Never Choose SOM by Guessing a Percentage
- A Better SOM Calculation
- TAM vs SAM vs SOM Example
- TAM, SAM and SOM Are Nested Markets
- TAM vs Market Size
- TAM vs Revenue Forecast
- SAM vs Target Market
- SOM vs Sales Target
- The Most Important Part of TAM SAM SOM: Market Definition
- Bad TAM Example
- Revenue Pool vs Transaction Volume
- How to Calculate TAM SAM SOM
- Step 1: Define the Product
- Step 2: Define the Revenue Model
- Step 3: Define the Customer
- Step 4: Define Geography
- Step 5: Estimate TAM
- Step 6: Apply SAM Constraints
- Step 7: Estimate Commercial Reach
- Step 8: Estimate Conversion
- Step 9: Calculate SOM
- Step 10: Stress-Test
- Three Main Market Sizing Methods
- Top-Down Market Sizing
- Advantages of Top-Down Market Sizing
- Problems With Top-Down Market Sizing
- Bottom-Up Market Sizing
- Why Bottom-Up Market Sizing Is Powerful
- Bottom-Up B2B Example
- Value-Theory Market Sizing
- Best Practice: Triangulation
- TAM SAM SOM for SaaS
- TAM SAM SOM for a B2B Company
- TAM SAM SOM for eCommerce
- TAM SAM SOM for a Marketplace
- TAM SAM SOM for a Marketing Agency
- TAM SAM SOM for a Restaurant
- TAM SAM SOM for Real Estate
- TAM SAM SOM for an App
- TAM SAM SOM for a Startup
- TAM SAM SOM and Investors
- How to Present TAM SAM SOM in a Pitch Deck
- TAM SAM SOM and Market Research
- Market Sizing Sources
- TAM SAM SOM in Egypt
- TAM SAM SOM and STP Marketing
- TAM SAM SOM and Go-to-Market Strategy
- TAM SAM SOM and the Ansoff Matrix
- TAM SAM SOM and BCG Matrix
- TAM SAM SOM and Product Marketing
- TAM SAM SOM and Pricing
- TAM SAM SOM and Market Growth
- TAM SAM SOM and Competitive Market Share
- TAM SAM SOM and Sales Capacity
- TAM SAM SOM and Delivery Capacity
- TAM SAM SOM and Marketing Budget
- TAM SAM SOM and CAC
- TAM SAM SOM and Revenue Planning
- TAM SAM SOM and Reverse Planning
- Common TAM SAM SOM Mistakes
- Mistake 1: Starting With an Enormous Global Number
- Mistake 2: TAM Equals “Everyone”
- Mistake 3: SAM Is Just TAM × Random Percentage
- Mistake 4: SOM = 1% Because It Sounds Conservative
- Mistake 5: Confusing GMV With Revenue
- Mistake 6: Ignoring Pricing
- Mistake 7: Ignoring Competitors
- Mistake 8: Ignoring Sales Capacity
- Mistake 9: Ignoring Delivery Capacity
- Mistake 10: Mixing Time Periods
- Mistake 11: Mixing Geographies
- Mistake 12: Using Search Volume as Market Size
- Mistake 13: Double Counting Customers
- Mistake 14: Using List Price Instead of Real Revenue
- Mistake 15: Never Updating the Model
- Why “If We Capture Just 1%” Is Weak Analysis
- Conservative, Base and Aggressive Scenarios
- TAM SAM SOM Sensitivity Analysis
- Market Sizing Confidence Levels
- TAM SAM SOM Research Template
- TAM SAM SOM Validation Checklist
- What a Professional TAM SAM SOM Report Should Contain
- How Udjat Approaches TAM, SAM and SOM Research
- TAM SAM SOM Quick Facts
- Frequently Asked Questions About TAM vs SAM vs SOM
- What does TAM stand for?
- What does SAM stand for?
- What does SOM stand for?
- What is TAM?
- What is SAM?
- What is SOM?
- What is the difference between TAM and SAM?
- What is the difference between SAM and SOM?
- Which is bigger: TAM, SAM or SOM?
- Can TAM and SAM be equal?
- Can SAM and SOM be equal?
- How do you calculate TAM?
- How do you calculate SAM?
- How do you calculate SOM?
- What is an example of TAM?
- What is an example of SAM?
- What is an example of SOM?
- Is TAM the same as market size?
- Is SOM a sales forecast?
- Is SAM the same as target market?
- What is top-down market sizing?
- What is bottom-up market sizing?
- Which is better: top-down or bottom-up?
- What is market-size triangulation?
- What is a good SOM percentage?
- Is 1% SOM realistic?
- Should SOM be one-year or five-year?
- How do you calculate TAM for SaaS?
- How do you calculate TAM for eCommerce?
- How do you calculate TAM for a marketplace?
- How do you calculate TAM for services?
- Can market research help calculate TAM SAM SOM?
- What sources should be used for TAM SAM SOM?
- Can Google search volume calculate TAM?
- Can AI calculate TAM SAM SOM?
- Why do investors ask about TAM SAM SOM?
- Should TAM SAM SOM be included in a pitch deck?
- How does TAM SAM SOM connect with STP?
- How does TAM SAM SOM connect with Go-to-Market Strategy?
- How does TAM SAM SOM connect with Ansoff?
- How does TAM SAM SOM connect with Market Research?
- Can Udjat calculate TAM SAM SOM?
- How can I start a market-sizing project with Udjat?
- Conclusion: The Biggest Market Number Is Usually the Least Useful One
- Sources
TAM vs SAM vs SOM: How to Calculate Your Real Market Opportunity
A startup presents its investor deck.
One slide proudly says:
Our market is worth $20 billion.
That sounds impressive.
Then someone asks:
How much of that market can your company actually serve?
Silence.
Then:
How much could you realistically capture during the next three years?
Another silence.
This is exactly why businesses need to understand TAM vs SAM vs SOM.
A massive market does not automatically create a massive business opportunity.
There are three different questions:
TAM
How large could the total market theoretically be?
SAM
How much of that market can our current business actually serve?
SOM
How much could we realistically capture?
The relationship is:
TAM
↓
SAM
↓
SOM
Or:
Entire Opportunity
↓
Relevant Opportunity
↓
Obtainable Opportunity
Amazon’s current market-sizing guidance similarly defines TAM as the total potential opportunity, SAM as the relevant portion the business can serve, and SOM as the portion that could reasonably be captured.
At Udjat Agency, we use market sizing as part of a wider research process rather than as an exercise in producing the largest possible number.
The purpose is not:
Make the opportunity look impressive.
It is:
Understand whether the opportunity is commercially attractive enough to justify investment.
A useful market-sizing process is:
Market Definition
↓
TAM
↓
Product / Geography / Segment Constraints
↓
SAM
↓
Competition / Capacity / GTM Constraints
↓
SOM
↓
Revenue Scenario
↓
Investment Decision
What Do TAM, SAM and SOM Stand For?
The three terms are:
TAM
Total Addressable Market
SAM
Usually:
Serviceable Addressable Market
and sometimes called:
Serviceable Available Market
SOM
Serviceable Obtainable Market
Together, they provide three levels of market size.
| Metric | Meaning | Main Question |
|---|---|---|
| TAM | Total Addressable Market | What is the maximum theoretical market? |
| SAM | Serviceable Addressable Market | What part can our current offer serve? |
| SOM | Serviceable Obtainable Market | What part could we realistically win? |
The most important principle is:
TAM should normally be larger than SAM, and SAM should normally be larger than SOM.
If your SOM is larger than your SAM:
something is wrong with the market definition or calculation.
TAM vs SAM vs SOM in Simple Words
Imagine the entire market is an ocean.
TAM
The whole ocean.
SAM
The part of the ocean where your boat can operate.
SOM
The amount of fish you could realistically catch.
Another analogy:
Imagine you open a restaurant in Cairo.
TAM
Everyone who could theoretically spend money on the category you serve.
SAM
Customers within the geography, price range and target segment the restaurant can actually serve.
SOM
The number of customers your location, capacity, marketing and competitive position could realistically attract.
That distinction prevents:
market size
from being confused with:
business forecast.
TAM: What Is Total Addressable Market?
TAM stands for Total Addressable Market.
It represents the total theoretical revenue opportunity available if one company captured 100% of the defined market.
A simplified formula is:
TAM = Total Potential Customers × Average Annual Revenue per Customer
Suppose:
Potential customers:
100,000 companies
Average annual spend:
EGP 60,000
Then:
100,000 × EGP 60,000
=
EGP 6 billion TAM
This does not mean the business will generate EGP 6 billion.
It means:
Under this market definition, the theoretical revenue pool is approximately EGP 6 billion.
TAM Is a Ceiling, Not a Revenue Forecast
This distinction is critical.
If your TAM is:
EGP 10 billion
that does not mean:
We expect EGP 10 billion revenue.
The TAM may contain customers you will:
- Never reach.
- Never serve.
- Never convert.
- Lose to competitors.
TAM helps answer:
Is the overall opportunity potentially large enough?
It does not answer:
How much will we make next year?
What Should Be Included in TAM?
TAM depends entirely on how the market is defined.
Suppose you sell CRM software.
Possible market definitions include:
Very Broad
All businesses worldwide needing CRM.
Regional
All CRM buyers across MENA.
Geographic
All CRM buyers in Egypt.
Segment-Specific
All Egyptian mid-market companies needing CRM.
Each produces a different TAM.
There is no value in creating an enormous TAM by defining the market so broadly that it becomes commercially meaningless.
TAM Example: SaaS
Imagine a SaaS company selling software to logistics companies.
Potential global customers:
250,000
Average annual subscription:
EGP 100,000 equivalent
Then:
250,000 × 100,000
=
EGP 25 billion TAM
Again:
That is the theoretical maximum.
Not the realistic opportunity.
TAM Example: Consumer Product
Suppose a skincare company estimates:
Potential relevant annual buyers:
5 million
Average category spend:
EGP 2,000 annually
Then:
5,000,000 × 2,000
=
EGP 10 billion TAM
The next question is:
Can the company actually serve all five million customers?
Probably not.
That leads to SAM.
SAM: What Is Serviceable Addressable Market?
SAM stands for Serviceable Addressable Market.
It represents the part of TAM that your current:
- Product.
- Geography.
- Customer segment.
- Business model.
- Distribution.
- Regulatory environment.
can actually serve.
If TAM asks:
Who could theoretically need this category?
SAM asks:
Who can our company actually serve with the Product and market coverage we are building?
SAM Formula
A simple bottom-up formula is:
SAM = Number of Serviceable Customers × Average Annual Revenue per Customer
Suppose your TAM includes:
100,000 companies.
But your Product currently works only for:
- Egypt.
- Companies with 50+ employees.
- Certain industries.
That leaves:
12,000 suitable companies.
Average annual contract:
EGP 60,000
Then:
SAM = 12,000 × 60,000
=
EGP 720 million
Now the opportunity becomes more relevant.
Why TAM and SAM Can Be Very Different
The global market might contain:
one million potential customers.
But you currently:
- Serve Egypt only.
- Support Arabic and English only.
- Need local implementation.
- Focus on companies with 100+ employees.
Your SAM may represent only a small fraction of TAM.
That is completely normal.
A smaller, defensible SAM is more useful than an inflated market estimate.
What Can Reduce TAM Into SAM?
Common filters include:
Geography
You serve Egypt but not Europe.
Regulation
Your Product is approved only for particular markets.
Language
Your current experience supports Arabic and English.
Industry
Your Product serves manufacturers but not retailers.
Company Size
You serve enterprise, not microbusinesses.
Product Capability
Certain customers require features you do not provide.
Distribution
You cannot currently reach some markets.
Business Model
The Product economics do not work for certain customer segments.
Every meaningful constraint can narrow TAM into SAM.
SAM Example: Egyptian SaaS Company
TAM:
All MENA companies that could potentially use the software:
EGP 8 billion
But the company currently supports:
- Egypt.
- Saudi Arabia.
- Companies with 100–1,000 employees.
The serviceable opportunity might be:
EGP 1.4 billion SAM
The difference is not bad.
It is more realistic.
SOM: What Is Serviceable Obtainable Market?
SOM stands for Serviceable Obtainable Market.
This is the part of your SAM that the business could realistically capture within a defined timeframe.
This is where market sizing begins to meet:
- Competition.
- Marketing.
- Sales.
- Capacity.
- Capital.
- Brand awareness.
- Distribution.
- Product maturity.
TAM asks:
What exists?
SAM asks:
What can we serve?
SOM asks:
What could we realistically win?
SOM Formula
One simplified approach is:
SOM = SAM × Realistic Obtainable Market Share
Suppose:
SAM:
EGP 720 million
You estimate a realistic five-year obtainable share:
5%
Then:
EGP 720 million × 5%
=
EGP 36 million SOM
That means the realistic target under those assumptions is approximately:
EGP 36 million annual revenue opportunity
within the defined timeframe.
But:
Why 5%?
That is the important question.
Never Choose SOM by Guessing a Percentage
One of the weakest pitch-deck arguments is:
The market is worth $5 billion. If we capture just 1%, we will make $50 million.
Why:
1%?
Why not:
0.1%?
Why not:
5%?
Without evidence, the percentage means almost nothing.
SOM should be built from realistic commercial assumptions.
A Better SOM Calculation
Suppose there are:
12,000 serviceable companies.
Your sales and marketing model can realistically reach:
3,000 per year.
Of those:
20% become qualified opportunities.
600 opportunities
Sales closes:
20%.
That gives:
120 new customers per year
Average contract:
EGP 60,000
Annual new revenue:
EGP 7.2 million
This is a far more useful commercial model than:
Let’s capture 1%.
It links market size with actual:
GTM capacity.
TAM vs SAM vs SOM Example
Imagine a SaaS business.
TAM
100,000 potential businesses.
Average annual contract:
EGP 60,000.
TAM = EGP 6 billion
SAM
Only 12,000 companies fit:
- Geography.
- Industry.
- Size.
- Product requirements.
SAM = EGP 720 million
SOM
The company believes it can realistically acquire:
600 customers
within the defined planning period.
600 × EGP 60,000
=
EGP 36 million SOM
So:
TAM = EGP 6B
↓
SAM = EGP 720M
↓
SOM = EGP 36M
That tells a much more useful story than:
We operate in a EGP 6 billion market.
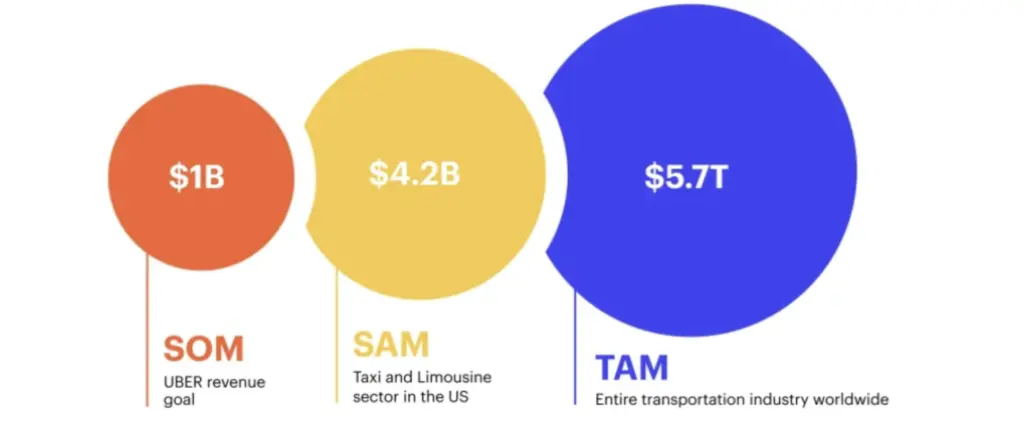
TAM, SAM and SOM Are Nested Markets
Think of them as three circles.
Largest Circle
TAM.
Everything potentially relevant to the category.
Inside It
SAM.
Customers you can serve.
Inside SAM
SOM.
Customers you can realistically win.
They should not be added together.
Wrong:
TAM + SAM + SOM
These are not separate revenue streams.
They are progressively narrower views of the same opportunity.
TAM vs Market Size
TAM is often referred to simply as:
market size.
But the terms are not always interchangeable.
“Market size” might refer to:
- Total category revenue.
- Current annual sales.
- Units sold.
- Number of customers.
TAM specifically means:
the total addressable opportunity under a defined market model.
Always state:
- Geography.
- Period.
- Customer definition.
- Revenue basis.
Otherwise market-size numbers can be misleading.
TAM vs Revenue Forecast
TAM:
Theoretical market ceiling.
Revenue forecast:
What your company expects to sell.
Example:
TAM:
EGP 10B
Revenue forecast next year:
EGP 20M
These numbers solve completely different problems.
SAM vs Target Market
SAM is closely related to the target market but is expressed as an economic opportunity.
A target market might be:
Mid-sized Egyptian manufacturers.
SAM asks:
How much total annual revenue opportunity exists within that targetable group for our offer?
This is where STP Marketing can connect directly with market sizing.
SOM vs Sales Target
SOM and sales target are also related but not identical.
SOM
Reasonable obtainable market opportunity.
Sales Target
What management commits the organization to achieve.
Suppose SOM indicates:
EGP 40M annual obtainable opportunity.
Management might set next year’s target at:
EGP 15M
based on:
- Team capacity.
- Ramp time.
- Marketing budget.
Do not automatically treat SOM as the annual sales target.
The Most Important Part of TAM SAM SOM: Market Definition
Market sizing begins with:
What market are we measuring?
This sounds obvious.
It is where many analyses fail.
Suppose a company sells:
appointment software for dental clinics.
Should TAM be:
the entire global software market?
Obviously not.
Could it be:
the global healthcare software market?
Still too broad.
A better market definition may be:
dental-practice scheduling and patient-management software for independent and group dental clinics within the target geographies.
Now the sizing has meaning.
Bad TAM Example
A mobile restaurant-ordering startup says:
The global food market is worth trillions, so our TAM is trillions.
Wrong.
The company does not earn:
all food spending.
Its TAM should relate to the economic value it could actually capture through its Product and revenue model.
Revenue Pool vs Transaction Volume
This distinction is particularly important for:
- Marketplaces.
- Fintech.
- Platforms.
Suppose a marketplace processes:
EGP 10 billion GMV.
But earns:
5% commission.
Its revenue opportunity is:
EGP 500 million
not:
EGP 10 billion.
If discussing revenue TAM, use:
revenue the business could earn.
Not gross transaction value unless clearly labelled.
How to Calculate TAM SAM SOM
A professional process can follow these steps.
Step 1: Define the Product
What exactly are you selling?
Step 2: Define the Revenue Model
How does the company make money?
Examples:
- Subscription.
- Commission.
- Product sale.
- Retainer.
- License.
Step 3: Define the Customer
Who actually buys?
Step 4: Define Geography
Where can the Product operate?
Step 5: Estimate TAM
Calculate the broad category opportunity.
Step 6: Apply SAM Constraints
Filter by:
- Geography.
- Segment.
- Capability.
- Regulation.
- Distribution.
Step 7: Estimate Commercial Reach
How many SAM customers can your GTM model actually reach?
Step 8: Estimate Conversion
What percentage can become customers?
Step 9: Calculate SOM
Translate realistic customer acquisition into revenue.
Step 10: Stress-Test
Create:
- Conservative.
- Base.
- Aggressive.
scenarios.
This creates more useful decision-making than one exact-looking number.
Three Main Market Sizing Methods
Market sizing generally uses:
Top-Down
Start with a large market figure and narrow it.
Bottom-Up
Build market size from customer-level assumptions.
Value-Theory / Economic Value
Estimate the value created and the portion the business might capture.
In practice, strong research often triangulates more than one approach.
Top-Down Market Sizing
Top-down starts with:
a large published market number.
Then narrows it.
Example:
Market report:
Egyptian software market = hypothetical EGP 50B.
Target category represents:
10%.
Target customer size:
20%.
Then:
50B × 10% × 20%
=
EGP 1B
estimated relevant opportunity.
Advantages of Top-Down Market Sizing
- Fast.
- Useful for macro context.
- Useful for comparison.
- Useful when good industry data exists.
Problems With Top-Down Market Sizing
Every percentage creates another assumption.
Suppose management says:
20% of companies should need us.
Why?
A chain of unsupported percentages can produce an impressive but unreliable number.
This is why top-down estimates should often be verified with bottom-up analysis.
Bottom-Up Market Sizing
Bottom-up begins with:
actual customer economics.
Formula:
Number of Potential Customers × Expected Annual Revenue per Customer
Example:
Potential target accounts:
5,000
Annual contract:
EGP 100,000
Market:
EGP 500 million
This tends to make assumptions easier to inspect.
Why Bottom-Up Market Sizing Is Powerful
It forces management to answer:
- Who exactly is the customer?
- How many exist?
- What will they buy?
- What will they pay?
Those are commercially meaningful assumptions.
Amazon’s TAM/SAM/SOM guide likewise illustrates TAM through potential customer count multiplied by average revenue per customer.
Bottom-Up B2B Example
Suppose you sell industrial software.
Target companies:
2,500.
Average annual contract:
EGP 200,000.
TAM = 2,500 × 200,000
=
EGP 500 million
Then SAM might include only:
1,200 companies
where the Product currently integrates with their systems.
SAM = EGP 240 million
Now suppose:
realistic five-year customer count:
SOM = 240 × 200,000
=
EGP 48 million
This is highly defensible because every step can be challenged and improved.
Value-Theory Market Sizing
Value theory can help when the Product creates a measurable economic outcome.
Suppose software saves a manufacturer:
EGP 1 million annually.
If customers might rationally pay:
10% of created value
then potential annual price:
EGP 100,000.
Multiply by the relevant customer population to build another perspective on market opportunity.
This can be useful for:
- New categories.
- Innovation.
- Products without mature market benchmarks.
But willingness to pay still requires validation.
Best Practice: Triangulation
Do not rely blindly on one calculation.
Use:
Top-Down
Industry-market perspective.
Bottom-Up
Customer economics.
Primary Research
Customer demand and willingness to pay.
If several methods produce broadly compatible estimates:
confidence improves.
If:
Top-down TAM = EGP 10B
and:
Bottom-up TAM = EGP 600M
investigate.
Do not simply publish the larger one.
TAM SAM SOM for SaaS
SaaS is particularly suited to bottom-up sizing.
Suppose:
Potential global customer accounts:
50,000.
Average ARR:
EGP 120,000.
TAM
50,000 × 120,000
=
EGP 6B
The Product currently supports Egypt + GCC and targets only businesses with 50+ employees.
Relevant accounts:
10,000.
SAM
10,000 × 120,000
=
EGP 1.2B
Realistically obtainable accounts after five years:
SOM
800 × 120,000
=
EGP 96M ARR
This makes the growth story concrete.
TAM SAM SOM for a B2B Company
Imagine an industrial machinery provider.
TAM
All suitable factories across target region × annual equipment/service spend.
SAM
Factories in geographies the company can service.
SOM
Factories realistically obtainable based on:
- Sales team.
- Distribution.
- Purchasing cycles.
- Competitor relationships.
B2B SOM can be especially influenced by long sales cycles.
If only:
100 contracts
come to market annually:
your practical opportunity is very different from the total installed base.
TAM SAM SOM for eCommerce
Suppose an eCommerce brand sells premium fitness apparel.
TAM
All relevant fitness-apparel category spending.
SAM
Online buyers within:
- Target countries.
- Price segment.
- Product category.
SOM
Realistically obtainable revenue based on:
- Traffic.
- Media budget.
- Conversion.
- Inventory.
- Fulfillment.
This can be modelled as:
Reachable Visitors
×
Conversion Rate
×
Average Order Value
×
Purchase Frequency
That connects market sizing to eCommerce economics.
TAM SAM SOM for a Marketplace
Marketplaces require special care.
Suppose:
Total annual transaction value in relevant market:
EGP 4B GMV
Marketplace commission:
10%
Potential revenue TAM:
EGP 400M
If the marketplace realistically serves half the category:
SAM:
EGP 200M potential revenue
If the company can capture 10%:
SOM:
EGP 20M potential revenue
Always distinguish:
GMV
from:
company revenue.
TAM SAM SOM for a Marketing Agency
Imagine an agency specializing in mid-sized Egyptian companies.
TAM
All potential marketing-services spend among the broad relevant company population.
SAM
Companies that fit:
- Geography.
- Budget.
- Industry.
- Agency model.
SOM
Companies the agency could realistically acquire and service given:
- Sales capacity.
- Team capacity.
- Average client value.
- Retention.
Service businesses face an additional constraint:
delivery capacity.
Even if market demand is enormous:
the agency may not be able to serve unlimited customers.
TAM SAM SOM for a Restaurant
Restaurants are constrained heavily by geography and capacity.
TAM
Relevant food-service spending within a broad market.
SAM
Customers inside the restaurant’s realistic catchment and price segment.
SOM
Revenue realistically achievable based on:
- Seats.
- Table turns.
- Opening hours.
- Delivery.
- Occupancy.
A useful SOM cannot exceed operational capacity.
TAM SAM SOM for Real Estate
Real-estate market sizing can consider:
- Target geography.
- Property type.
- Buyer budget.
- Demand.
- Transaction volume.
For a specific development:
TAM
All relevant property demand.
SAM
Buyers who fit:
- Location.
- Price.
- Product.
SOM
Realistically capturable sales based on:
- Project inventory.
- Sales capacity.
- Competition.
- Launch period.
Again:
available inventory creates a hard cap.
TAM SAM SOM for an App
Apps often produce inflated TAM calculations.
Weak:
There are 5 billion smartphone users. Our TAM is 5 billion people.
Better:
Who has the problem?
Who would install?
Who would pay?
What is the monetization model?
For a paid subscription app:
Relevant Potential Users × Annual Subscription Revenue
is much more useful.
TAM SAM SOM for a Startup
Startups use TAM/SAM/SOM to answer two separate questions.
Opportunity Question
Could this become a sufficiently large company?
Execution Question
Is the initial obtainable market focused enough to win?
A startup can have:
large TAM
and:
small initial SOM.
That can be healthy.
Many companies begin with a narrow beachhead market.
The strategic sequence can be:
Initial SOM
↓
Market Penetration
↓
Product Development
↓
Market Development
↓
Larger SAM
↓
Larger Future TAM
This connects market sizing directly with the Ansoff Matrix.
TAM SAM SOM and Investors
Investors often use market-sizing analysis to evaluate whether:
- The opportunity is meaningful.
- The founders understand the market.
- Assumptions are credible.
- Growth can support the investment case.
The weakest presentation is:
Gartner says the market is $50 billion and we only need 1%.
The stronger presentation is:
There are approximately X target accounts matching our ICP, average contract value is Y, producing a serviceable market of Z. Our current sales capacity and validated conversion assumptions support an initial obtainable opportunity of A.
The second demonstrates:
commercial understanding.
How to Present TAM SAM SOM in a Pitch Deck
One slide can show:
TAM
EGP 6.0B
All relevant category customers.
SAM
EGP 720M
Customers matching current:
- Geography.
- Segment.
- Product.
SOM
EGP 36M
Realistic obtainable revenue under the five-year GTM model.
Then beneath the numbers:
Methodology
- Bottom-up.
- Number of accounts.
- Average annual contract value.
- Sources.
- Key assumptions.
The assumptions are often more important than the graphic.
TAM SAM SOM and Market Research
TAM, SAM and SOM should ideally come from a professional Market Research process.
Research can provide:
Customer Population
How many buyers exist?
Category Spending
How much do they spend?
Segmentation
Which customers fit?
Pricing
What annual revenue per customer is realistic?
Competitor Share
How difficult is acquisition?
Growth
How will the opportunity change?
Without research, market sizing can become:
spreadsheet fiction.
Market Sizing Sources
Potential sources include:
Government Statistics
Useful for:
- Population.
- Companies.
- Industries.
- Economic data.
Regulators
Useful for specialized markets.
Trade Associations
Category statistics.
Company Reports
Revenue and market information.
Customer Research
Spending and purchase behaviour.
CRM
Actual deal values.
Competitor Research
Pricing and positioning.
Primary Surveys
Demand and adoption.
The strongest model often combines several.
TAM SAM SOM in Egypt
For Egyptian market sizing, relevant official sources may include:
- CAPMAS.
- GAFI.
- Central Bank of Egypt.
- ITIDA.
- Government ministries.
- Sector regulators.
But official data still needs careful interpretation.
Suppose CAPMAS reports:
X businesses in a sector.
That does not mean every one is:
a potential customer.
You may need to filter by:
- Size.
- Location.
- Revenue.
- Technology maturity.
- Need.
Official data helps establish the population.
Market research creates the commercial market.
TAM SAM SOM and STP Marketing
TAM/SAM/SOM and STP Marketing solve related problems.
TAM
Broad market.
Segmentation
Divide it.
SAM
Identify customers the business can serve.
Targeting
Choose which deserve priority.
SOM
Estimate what can realistically be won.
This creates:
TAM
↓
Segmentation
↓
SAM
↓
Targeting
↓
SOM
↓
Positioning
That is much stronger than treating market sizing as an isolated finance exercise.
TAM SAM SOM and Go-to-Market Strategy
Market sizing should feed directly into Go-to-Market Strategy.
Suppose:
TAM:
EGP 10B.
SAM:
EGP 1B.
SOM:
EGP 50M.
GTM then asks:
How do we actually capture that EGP 50M?
Define:
- ICP.
- Positioning.
- Price.
- Route to market.
- Marketing.
- Sales.
- Conversion.
SOM becomes the bridge between:
market research
and:
commercial execution.
TAM SAM SOM and the Ansoff Matrix
The Ansoff Matrix can change your market sizing.
Market Penetration
Same Product + same Market.
SOM increases by winning more share.
Market Development
Existing Product + new Market.
SAM expands.
Product Development
New Product + current Market.
Revenue opportunity expands through new customer needs.
Diversification
New Product + new Market.
A new TAM may need to be calculated completely.
Market sizing should therefore be updated when strategy changes.
TAM SAM SOM and BCG Matrix
The BCG Matrix evaluates:
- Market growth.
- Relative market share.
TAM/SAM/SOM adds another perspective:
How large is the absolute opportunity?
A Product could operate in:
high-growth market
but still have:
tiny total opportunity.
Both dimensions matter.
TAM SAM SOM and Product Marketing
Product Marketing can help refine SAM.
Customer research may discover:
Only Segment A strongly values the Product.
That can dramatically shrink:
SAM.
This is not necessarily bad.
A precise SAM can produce better:
- Product.
- Positioning.
- GTM.
TAM SAM SOM and Pricing
Market size depends directly on price when measured as revenue.
Suppose:
10,000 customers.
At:
EGP 10,000 annual price:
TAM = EGP 100M.
At:
EGP 50,000:
TAM = EGP 500M.
Does that mean raising price automatically makes the market five times larger?
No.
Higher prices can reduce the number of customers willing to buy.
Pricing and market size must be considered together.
This is why Market Research can include pricing research rather than using arbitrary revenue-per-customer assumptions.
TAM SAM SOM and Market Growth
Market sizing is usually a snapshot.
But markets change.
Suppose current TAM:
EGP 1B.
Market growth:
20% annually.
Future TAM may expand significantly.
A useful analysis might include:
Current TAM
Forecast TAM
But forecasts should clearly state:
- Growth assumption.
- Source.
- Period.
Do not mix current SAM with future TAM without labelling them.
TAM SAM SOM and Competitive Market Share
SOM should consider existing competition.
Suppose SAM:
EGP 1B.
But:
- Market leader holds 60%.
- Second player holds 25%.
- Switching costs are high.
Claiming:
Our SOM is EGP 500M
would mean capturing:
half the entire serviceable market.
Possible?
Perhaps.
Realistic?
It requires enormous evidence.
Competitive structure matters.
TAM SAM SOM and Sales Capacity
Imagine enterprise sales.
Average salesperson closes:
10 customers annually.
You have:
3 salespeople.
Maximum realistic annual acquisition:
approximately:
30 customers
before additional hiring.
If each contract is:
EGP 500,000,
near-term new business capacity:
EGP 15M
This constraint should influence your short-term obtainable-market assumptions.
Market demand is not the only limit.
TAM SAM SOM and Delivery Capacity
This is particularly important for services.
A consulting firm may have:
SAM:
EGP 2B.
But:
20 consultants.
Each can manage:
5 major engagements annually.
Capacity:
100 engagements.
Average engagement:
EGP 500,000.
Annual delivery capacity:
EGP 50M.
Without hiring:
the business cannot obtain EGP 500M no matter how large the SAM is.
TAM SAM SOM and Marketing Budget
Customer acquisition requires resources.
Suppose:
Target SOM requires:
1,000 customers.
Expected CAC:
EGP 10,000.
Acquisition investment:
EGP 10M
If the company has:
EGP 500,000 acquisition budget,
the SOM assumptions may not be commercially achievable within the proposed timeframe.
Connect:
market size
with:
capital requirements.
TAM SAM SOM and CAC
A simplified acquisition model:
Required Customers × CAC = Required Acquisition Budget
Suppose:
SOM target:
500 customers.
CAC:
EGP 20,000.
Required acquisition spend:
EGP 10M
This does not include every sales and marketing cost, but it creates a sanity check.
TAM SAM SOM and Revenue Planning
You can translate SOM into a revenue plan.
Example:
Five-year SOM:
600 customers.
Ramp:
Year 1
50 customers.
Year 2
Year 3
Year 4
Year 5
This is more useful than pretending:
SOM becomes revenue immediately.
Commercial capacity takes time.
TAM SAM SOM and Reverse Planning
You can also work backwards.
Target revenue:
EGP 30M.
Average annual customer value:
EGP 100,000.
Required customers:
300
Win rate:
25%.
Required opportunities:
1,200
Opportunity creation rate from qualified leads:
40%.
Required qualified leads:
3,000
Now ask:
Does our SAM contain enough reachable customers to support this model?
Market sizing and revenue planning begin to connect.
Common TAM SAM SOM Mistakes
Mistake 1: Starting With an Enormous Global Number
Broad does not mean useful.
Mistake 2: TAM Equals “Everyone”
Your Product rarely serves everyone.
Mistake 3: SAM Is Just TAM × Random Percentage
Filters need evidence.
Mistake 4: SOM = 1% Because It Sounds Conservative
Random small numbers are still random.
Mistake 5: Confusing GMV With Revenue
Especially marketplaces.
Mistake 6: Ignoring Pricing
Market value depends partly on revenue per customer.
Mistake 7: Ignoring Competitors
You are not entering an empty market.
Mistake 8: Ignoring Sales Capacity
A giant market does not create an infinite sales team.
Mistake 9: Ignoring Delivery Capacity
Particularly for services.
Mistake 10: Mixing Time Periods
Current TAM vs five-year SOM must be labelled clearly.
Mistake 11: Mixing Geographies
Global TAM.
Egyptian SAM.
GCC SOM.
Possible—but explain the structure.
Mistake 12: Using Search Volume as Market Size
Google searches are not the same as customers.
Mistake 13: Double Counting Customers
Avoid counting the same customer in multiple segments.
Mistake 14: Using List Price Instead of Real Revenue
If average actual contract value is lower:
use the realistic number.
Mistake 15: Never Updating the Model
Markets, pricing and Product capabilities change.
Why “If We Capture Just 1%” Is Weak Analysis
This sentence appears constantly:
If we capture only 1% of the market…
But:
Why 1%?
A business could capture:
0.02%.
Another could reach:
20%.
The right assumption depends on:
- Competition.
- Product.
- Sales.
- Distribution.
- Capital.
- Customer switching.
- Market fragmentation.
Instead build SOM bottom-up.
Conservative, Base and Aggressive Scenarios
Market sizing should acknowledge uncertainty.
Example:
Conservative SOM
300 customers.
EGP 30M.
Base SOM
500 customers.
EGP 50M.
Aggressive SOM
800 customers.
EGP 80M.
Then define which assumptions create each scenario.
This gives management a range rather than false precision.
TAM SAM SOM Sensitivity Analysis
Test the variables that most affect the result.
For example:
| Variable | Low | Base | High |
|---|---|---|---|
| Target Companies | 8,000 | 10,000 | 12,000 |
| Annual Contract | EGP 50K | EGP 70K | EGP 90K |
| Obtainable Share | 3% | 5% | 8% |
The final opportunity can change dramatically.
Sensitivity analysis shows:
which assumptions deserve the most validation.
Market Sizing Confidence Levels
You can classify assumptions.
High Confidence
Government company count.
Medium Confidence
Estimated average category spending from interviews.
Low Confidence
Expected market share after five years.
Now management knows which parts of the calculation require additional research.
TAM SAM SOM Research Template
Product
What are we selling?
____________________________
Revenue Model
How do we earn money?
____________________________
Market Definition
What market are we measuring?
____________________________
Geography
____________________________
Potential Customers
____________________________
Annual Revenue per Customer
____________________________
TAM
____________________________
SAM Filters
Geography:
____________________________
Industry:
____________________________
Company size:
____________________________
Product fit:
____________________________
Regulation:
____________________________
Serviceable Customers
____________________________
SAM
____________________________
SOM Assumptions
Reachable customers:
____________________________
Qualification:
____________________________
Win rate:
____________________________
Sales capacity:
____________________________
Delivery capacity:
____________________________
Obtainable Customers
____________________________
SOM
____________________________
Timeframe
____________________________
TAM SAM SOM Validation Checklist
| Question | Clear? |
|---|---|
| Have we clearly defined the Product? | |
| Is the revenue model clear? | |
| Is the market definition specific? | |
| Are TAM customers genuinely relevant? | |
| Is average customer value evidence-based? | |
| Are SAM filters justified? | |
| Have we avoided double counting? | |
| Are competitors included? | |
| Is SOM based on a defined timeframe? | |
| Is sales capacity considered? | |
| Is delivery capacity considered? | |
| Is marketing investment considered? | |
| Are pricing assumptions realistic? | |
| Are sources documented? | |
| Have we created sensitivity scenarios? | |
| Can management explain every major assumption? |
If the company cannot explain the assumptions behind:
TAM
SAM
and:
SOM
the numbers should not be presented as precise facts.
What a Professional TAM SAM SOM Report Should Contain
A market-sizing study can include:
Executive Summary
The opportunity and recommendation.
Market Definition
Exactly what is included and excluded.
Methodology
Top-down, bottom-up or both.
TAM
Broad opportunity.
SAM
Serviceability filters.
SOM
Obtainability model.
Segmentation
Where value is concentrated.
Competitors
Existing market structure.
Pricing
Revenue assumptions.
Growth
Current and forecast opportunity.
Sensitivity
Alternative scenarios.
GTM Implications
What the business needs to do to capture SOM.
Risks
What could make the estimate wrong.
Recommendation
Whether the opportunity justifies further investment.
How Udjat Approaches TAM, SAM and SOM Research
Udjat can connect market sizing with the broader Market Research Company Egypt process.
The approach can include:
Market Definition
↓
Secondary Research
↓
Market Population
↓
Customer Segmentation
↓
Primary Research
↓
Pricing
↓
TAM
↓
SAM
↓
SOM
↓
Competitor Analysis
↓
GTM Feasibility
↓
Commercial Recommendation
The objective is not to produce the largest TAM.
It is to identify:
the most defensible commercial opportunity.
TAM SAM SOM Quick Facts
TAM = Total Addressable Market.
SAM = Serviceable Addressable Market.
SOM = Serviceable Obtainable Market.
TAM is the theoretical maximum opportunity.
SAM is the part the business can serve.
SOM is the part the business can realistically capture.
TAM ≥ SAM ≥ SOM.
TAM is not a revenue forecast.
SOM should have a defined timeframe.
Bottom-up market sizing starts from customer count and customer economics.
Top-down sizing starts from a broader market estimate and narrows it.
Strong market research can use both approaches to triangulate the opportunity.
A random 1% market-share assumption is not a defensible SOM calculation.
Market sizing should be updated when Products, markets, pricing or strategy change.
Frequently Asked Questions About TAM vs SAM vs SOM
What does TAM stand for?
TAM stands for:
Total Addressable Market.
What does SAM stand for?
SAM usually stands for:
Serviceable Addressable Market.
It is also sometimes described as:
Serviceable Available Market.
What does SOM stand for?
SOM stands for:
Serviceable Obtainable Market.
What is TAM?
TAM is the total theoretical revenue opportunity for a Product or service if it captured the entire defined market.
What is SAM?
SAM is the portion of TAM the business can actually serve according to constraints such as:
- Geography.
- Product.
- Customer segment.
- Regulation.
What is SOM?
SOM is the portion of SAM the company could realistically capture within a specified timeframe.
What is the difference between TAM and SAM?
TAM measures the broad theoretical opportunity.
SAM removes customers the current business cannot serve.
What is the difference between SAM and SOM?
SAM represents everything the business can serve.
SOM estimates what it can realistically win.
Which is bigger: TAM, SAM or SOM?
Normally:
TAM > SAM > SOM.
Can TAM and SAM be equal?
Yes.
If the business can genuinely serve the entire defined TAM.
This is less common when TAM is defined broadly.
Can SAM and SOM be equal?
Theoretically.
But this would imply capturing essentially the entire serviceable market, which generally requires exceptional justification.
How do you calculate TAM?
A simple bottom-up formula is:
Potential Customers × Average Annual Revenue per Customer.
How do you calculate SAM?
Estimate the number of customers that match the Product, geography and serviceability constraints, then multiply by realistic annual revenue per customer.
How do you calculate SOM?
Estimate the number of customers the company can realistically capture, then multiply by annual customer value.
Alternatively:
SAM × Realistic Obtainable Share
when the share assumption is well supported.
What is an example of TAM?
100,000 customers × EGP 60,000 annually =
EGP 6 billion TAM.
What is an example of SAM?
If only 12,000 of those customers fit the business:
12,000 × EGP 60,000 =
EGP 720 million SAM.
What is an example of SOM?
If the company could realistically capture 600:
600 × EGP 60,000 =
EGP 36 million SOM.
Is TAM the same as market size?
TAM is one market-size definition.
“Market size” may be used more broadly and should always specify what is being measured.
Is SOM a sales forecast?
Not exactly.
SOM represents a realistically obtainable opportunity.
A sales forecast should incorporate:
- Timing.
- Sales capacity.
- Ramp.
- Conversion.
Is SAM the same as target market?
They are related.
The target market defines the customer group.
SAM expresses the economic opportunity associated with serviceable customers.
What is top-down market sizing?
Starting with a broad industry figure and narrowing it using relevant filters.
What is bottom-up market sizing?
Building the market size from:
- Customer count.
- Pricing.
- Purchase frequency.
Which is better: top-down or bottom-up?
Neither should automatically be treated as perfect.
Bottom-up sizing often produces more transparent commercial assumptions, while top-down research can provide useful external context.
Using both can strengthen confidence.
What is market-size triangulation?
Using multiple independent methods or sources to see whether they support broadly similar conclusions.
What is a good SOM percentage?
There is no universal good percentage.
The realistic share depends on:
- Competitors.
- Product strength.
- Distribution.
- Marketing.
- Sales.
- Market structure.
Is 1% SOM realistic?
Maybe.
But the assumption should be justified.
Simply saying:
We only need 1%
is not a market-sizing methodology.
Should SOM be one-year or five-year?
It can use either timeframe.
But the timeframe must be explicitly stated.
For growth companies, a multi-year obtainable opportunity is commonly useful.
How do you calculate TAM for SaaS?
A common formula is:
Potential Accounts × Annual Recurring Revenue per Account
when subscription pricing is relatively consistent.
How do you calculate TAM for eCommerce?
Estimate:
Potential Buyers × Annual Category Spend
while ensuring the category and customer definitions match what the Product actually sells.
How do you calculate TAM for a marketplace?
Distinguish:
GMV
from:
revenue.
If the marketplace earns commission:
Transaction Value × Take Rate
can help estimate revenue opportunity.
How do you calculate TAM for services?
Estimate:
Potential Clients × Average Annual Service Revenue
and consider delivery capacity when calculating SOM.
Can market research help calculate TAM SAM SOM?
Yes.
Research can establish:
- Customer population.
- Segment size.
- Pricing.
- Competitor structure.
- Purchase behaviour.
What sources should be used for TAM SAM SOM?
Potential sources include:
- Government data.
- Regulators.
- Industry research.
- Company reports.
- Customer interviews.
- Surveys.
- CRM.
- Competitor analysis.
Can Google search volume calculate TAM?
Not reliably on its own.
Search volume measures search behaviour, not total customer or revenue opportunity.
Can AI calculate TAM SAM SOM?
AI can help organize calculations and research.
But the output is only as reliable as:
- Sources.
- Market definitions.
- Assumptions.
AI-generated numbers without evidence should not be presented as market facts.
Why do investors ask about TAM SAM SOM?
The model helps them evaluate:
- Overall upside.
- Market relevance.
- Initial realistic opportunity.
- Management’s understanding of the market.
Should TAM SAM SOM be included in a pitch deck?
For many startups and growth businesses, yes.
Especially when market opportunity is part of the investment thesis.
How does TAM SAM SOM connect with STP?
TAM identifies the broad opportunity.
STP divides and prioritizes the customer market.
SAM and SOM become increasingly specific as target customers are defined.
How does TAM SAM SOM connect with Go-to-Market Strategy?
SOM helps define the realistic commercial opportunity that the GTM plan is designed to capture.
How does TAM SAM SOM connect with Ansoff?
Market Development and Product Development can change SAM and TAM by expanding the markets or Products the business can serve.
How does TAM SAM SOM connect with Market Research?
Market research supplies much of the evidence required to calculate and validate the three market sizes.
Can Udjat calculate TAM SAM SOM?
Yes.
Udjat can connect:
Market Definition
↓
Market Research
↓
Customer Population
↓
Segmentation
↓
Pricing
↓
TAM
↓
SAM
↓
SOM
↓
Competitive Analysis
↓
Go-to-Market Strategy
The goal is not merely a market-size slide.
It is a defensible commercial opportunity model.
How can I start a market-sizing project with Udjat?
Bring:
- Product/service.
- Revenue model.
- Current pricing.
- Target customers.
- Geography.
- Existing customer data.
- Competitors.
- Expansion plans.
- Business objective.
Then meet Udjat Agency to identify the data needed to calculate a defensible TAM, SAM and SOM.
Conclusion: The Biggest Market Number Is Usually the Least Useful One
A founder says:
Our TAM is $30 billion.
That can sound impressive.
But the more useful questions are:
How much of that market can you actually serve?
and:
How much can your current business realistically capture?
That is why the complete model matters.
TAM
How large is the theoretical opportunity?
↓
SAM
How large is the opportunity our Product and business model can actually serve?
↓
SOM
How large is the opportunity we could realistically obtain?
The journey moves from:
possibility
to:
relevance
to:
commercial reality.
A strong market-sizing analysis therefore should not try to maximize TAM.
It should maximize:
credibility.
Start with:
a clearly defined market
then use:
reliable data
customer counts
realistic pricing
Product constraints
competitive structure
sales capacity
delivery capacity
to arrive at a defensible opportunity.
And remember:
TAM tells you whether the ocean is large. SOM tells you whether your company has a realistic way to catch anything in it.
That second question is usually more important.
If your company is preparing an investment case, feasibility study, new Product launch, Egypt market-entry plan or geographic expansion, meet Udjat Agency.
Before asking:
How large can we claim the market is?
ask:
How large is the market we can actually build a business around?
Sources
- Amazon Ads — TAM, SAM, SOM: What It Means and How to Calculate
Provides definitions of Total Addressable Market, Serviceable Addressable Market and Serviceable Obtainable Market and a customer-count × average-revenue approach to market sizing. - Udjat Agency — Market Research Guide
https://www.udjatagency.com/market-research-guide/ - Udjat Agency — Market Research Company Egypt
https://www.udjatagency.com/market-research-company-egypt/ - Udjat Agency — STP Marketing
https://www.udjatagency.com/stp-marketing/ - Udjat Agency — Ansoff Matrix
https://www.udjatagency.com/ansoff-matrix/ - Udjat Agency — Go-to-Market Strategy Egypt
https://www.udjatagency.com/go-to-market-strategy-egypt/