


Table of contents
- BCG Matrix: Stars, Cash Cows, Question Marks & Dogs Explained
- What Is the BCG Matrix?
- Who Created the BCG Matrix?
- What Does BCG Stand For?
- What Are the Two Axes of the BCG Matrix?
- What Is Market Growth Rate?
- Why Does Market Growth Matter?
- High Growth Does Not Automatically Mean Attractive
- What Is Relative Market Share?
- Relative Market Share Example
- Why Use Relative Market Share Instead of Market Share Alone?
- Why Was Market Share Important to the Original BCG Model?
- 1. Stars in the BCG Matrix
- Star Example
- What Should a Company Do With a Star?
- Can a Star Become a Cash Cow?
- Can a Star Fail?
- Star Marketing Strategy
- 2. Cash Cows in the BCG Matrix
- Cash Cow Example
- What Should a Company Do With a Cash Cow?
- Cash Cow Does Not Mean “Stop Marketing”
- Cash Cow Marketing Strategy
- Cash Cow and Pricing
- Cash Cow Example: Agency
- Cash Cow Example: FMCG
- 3. Question Marks in the BCG Matrix
- Question Mark Example
- Question Marks Can Consume Enormous Cash
- Questions to Ask About a Question Mark
- Question Mark Strategy
- Question Mark Example: Market Expansion
- Question Mark Marketing Strategy
- Question Mark to Star
- 4. Dogs in the BCG Matrix
- Dog Example
- Why Might a Dog Still Matter?
- Dog Strategies
- Dog Example: Marketing Service
- The Four BCG Quadrants Compared
- The Ideal BCG Portfolio
- BCG Success Sequence
- BCG Failure Sequence
- How to Build a BCG Matrix
- Step 1: Define the Portfolio
- Step 2: Define the Relevant Market
- Step 3: Calculate Market Growth
- Step 4: Estimate Market Share
- Step 5: Identify the Largest Competitor
- Step 6: Calculate Relative Market Share
- Step 7: Plot Each Business
- Step 8: Add Economics
- Step 9: Add Strategic Role
- Step 10: Make Resource Decisions
- Relative Market Share Formula
- What Is “High” Relative Market Share?
- What Is a High Market Growth Rate?
- BCG Matrix Example: SaaS Company
- BCG Matrix Example: Marketing Agency
- BCG Matrix Example: Restaurant Group
- BCG Matrix Example: eCommerce Business
- BCG Matrix Example: Real Estate Developer
- BCG Matrix Example: FMCG
- BCG Matrix for Small Businesses
- BCG Matrix for Startups
- BCG Matrix for B2B Businesses
- BCG Matrix for Service Companies
- BCG Matrix and Marketing Budget Allocation
- BCG Matrix and Revenue
- BCG Matrix and Profitability
- BCG Matrix and Customer Lifetime Value
- BCG Matrix and Market Research
- BCG Matrix and Marketing Strategy
- BCG Matrix and Ansoff Matrix
- BCG Matrix vs Ansoff Matrix
- BCG Matrix and STP Marketing
- BCG Matrix and Marketing 4Ps
- BCG Matrix and 7Ps Marketing
- BCG Matrix and SOSTAC
- BCG Matrix and Product Marketing
- BCG Matrix and Go-to-Market Strategy
- BCG Matrix and Revenue Operations
- BCG Matrix vs SWOT Analysis
- BCG Matrix vs Porter’s Five Forces
- BCG Matrix vs GE-McKinsey Matrix
- BCG Matrix vs Product Lifecycle
- Advantages of the BCG Matrix
- 1. Easy to Understand
- 2. Forces Portfolio Thinking
- 3. Encourages Resource Allocation
- 4. Balances Today and Tomorrow
- 5. Creates Strategic Questions
- 6. Highlights Competitive Position
- 7. Supports Marketing Prioritization
- Limitations of the BCG Matrix
- Limitation 1: Only Two Dimensions
- Limitation 2: Market Definition Is Subjective
- Limitation 3: Market Share Does Not Guarantee Profitability
- Limitation 4: Growth Does Not Guarantee Attractiveness
- Limitation 5: Dogs Can Still Be Valuable
- Limitation 6: Synergies Are Underrepresented
- Limitation 7: Static Snapshot
- Limitation 8: Share Can Be Hard to Measure
- Limitation 9: Modern Digital Economics Can Differ
- Limitation 10: It Can Encourage Oversimplified Decisions
- Is the BCG Matrix Still Relevant?
- A Modern BCG Matrix
- BCG Investment Scorecard
- Complete BCG Matrix Template
- BCG Strategy Template
- BCG Portfolio Audit
- Common BCG Matrix Mistakes
- Mistake 1: Using Revenue Instead of Market Share
- Mistake 2: Using Absolute Share Instead of Relative Share
- Mistake 3: Defining Markets Poorly
- Mistake 4: Assuming Star Means Profitable
- Mistake 5: Assuming Cash Cow Means Ignore
- Mistake 6: Funding Every Question Mark
- Mistake 7: Automatically Killing Dogs
- Mistake 8: Ignoring Economics
- Mistake 9: Using Outdated Data
- Mistake 10: Treating BCG as the Entire Strategy
- How Udjat Can Apply the BCG Matrix
- BCG Matrix Quick Facts
- Frequently Asked Questions About the BCG Matrix
- What is the BCG Matrix?
- What does BCG stand for?
- What is another name for the BCG Matrix?
- Who created the BCG Matrix?
- What are the four categories of the BCG Matrix?
- What is a Star in the BCG Matrix?
- What is a Cash Cow?
- What is a Question Mark?
- What is a Dog in the BCG Matrix?
- Should all Dogs be eliminated?
- What are the two axes of the BCG Matrix?
- How do you calculate relative market share?
- What does relative market share above 1 mean?
- What is market growth rate?
- What is a good market growth rate for the BCG Matrix?
- Can a Star become a Cash Cow?
- Can a Question Mark become a Star?
- Can a Question Mark become a Dog?
- Can a Cash Cow become a Dog?
- Are Stars always profitable?
- Are Cash Cows always the most profitable Products?
- What is the objective of the BCG Matrix?
- How is the BCG Matrix used in marketing?
- Can BCG be used for services?
- Can the BCG Matrix be used for brands?
- Can small businesses use the BCG Matrix?
- Can startups use the BCG Matrix?
- What are the advantages of the BCG Matrix?
- What are the disadvantages of the BCG Matrix?
- Is the BCG Matrix outdated?
- Is BCG Matrix the same as Ansoff Matrix?
- Which comes first: BCG or Ansoff?
- What is the difference between BCG and SWOT?
- What is the difference between BCG and Porter’s Five Forces?
- What is the difference between BCG and Product Lifecycle?
- How often should a BCG Matrix be updated?
- What data is required for a BCG Matrix?
- Can Udjat build a BCG portfolio analysis?
- How can I start a portfolio strategy project with Udjat?
- Conclusion: Not Every Product Deserves the Same Investment
- Sources
BCG Matrix: Stars, Cash Cows, Question Marks & Dogs Explained
Imagine a company with six products.
One generates most of the company’s cash.
Another is growing rapidly but consumes enormous investment.
A third operates in an exciting market but continues losing against the market leader.
A fourth has declining sales, limited market share and little strategic importance.
Management cannot treat all four the same.
The question is not simply:
Which product generated the most revenue this year?
Leadership needs to ask:
Which businesses should receive more investment?
Which should generate cash?
Which deserve another chance?
Which may no longer deserve scarce resources?
That is the strategic problem behind the BCG Matrix.
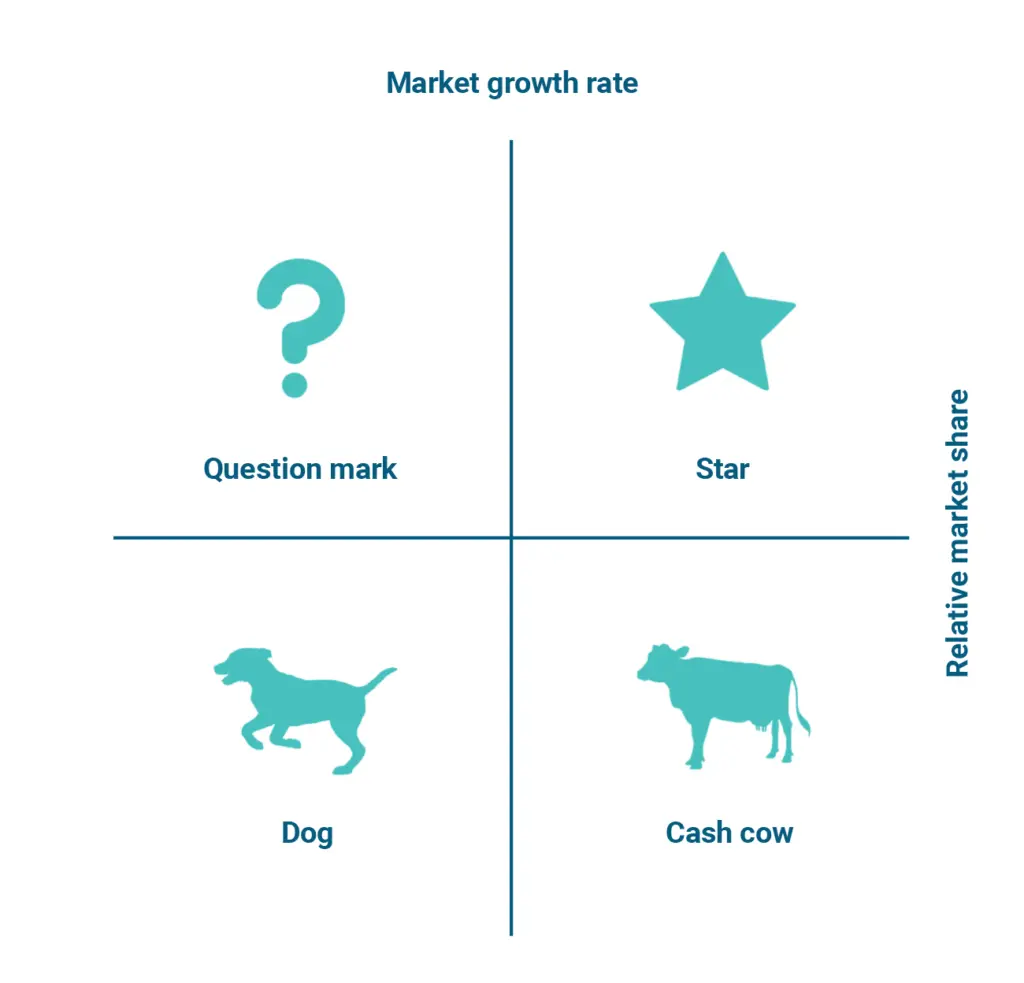
The BCG Matrix—also known as the Growth-Share Matrix—classifies products, brands or strategic business units into four categories:
Stars
Cash Cows
Question Marks
Dogs
using two main dimensions:
Market Growth Rate
and:
Relative Market Share
The basic matrix looks like this:
| High Relative Market Share | Low Relative Market Share | |
|---|---|---|
| High Market Growth | Star ⭐ | Question Mark ❓ |
| Low Market Growth | Cash Cow 🐄 | Dog 🐕 |
Each quadrant represents a different strategic situation.
Stars
High market share in high-growth markets.
Usually require continued investment.
Cash Cows
High market share in slower-growth markets.
Typically generate cash that can support other parts of the portfolio.
Question Marks
Low market share in high-growth markets.
Management must decide whether to invest heavily enough to build leadership or reduce exposure.
Dogs
Low market share in low-growth markets.
Often require restructuring, repositioning, harvesting or divestment—but they should not automatically be eliminated without understanding their strategic role.
At Udjat Agency, we would use the BCG Matrix as the beginning of a portfolio discussion rather than an automatic investment formula.
The real process should be:
Portfolio
↓
Market Growth
↓
Competitive Position
↓
Economics
↓
Strategic Role
↓
Investment Decision
↓
Marketing / Product Strategy
↓
Measurement
Because the Matrix gives management a useful picture.
It does not make the decision for them.
What Is the BCG Matrix?
The BCG Matrix is a portfolio-management framework designed to help companies compare different products, business units or brands according to:
- Market growth rate
- Relative market share
BCG describes the Growth-Share Matrix as a portfolio-management framework for deciding how companies should prioritize businesses and allocate resources and capital.
The framework reflects two underlying strategic ideas:
Market Growth
represents the attractiveness and investment demands of the market.
Relative Market Share
represents the competitive position of the business within that market.
The result is a simple two-by-two matrix.
BCG itself identifies the four quadrants as:
- Stars.
- Cash Cows.
- Question Marks.
- Pets, commonly represented as Dogs.
Who Created the BCG Matrix?
The Matrix was developed inside Boston Consulting Group during the late 1960s.
BCG’s historical account explains that Alan Zakon first sketched the framework and worked with colleagues to refine it.
BCG founder Bruce Henderson then popularized the concept through his 1970 essay:
The Product Portfolio.
Henderson argued that companies need a balanced portfolio containing businesses that:
- Consume investment.
- Generate cash.
- Offer future growth.
That portfolio logic became one of the most influential ideas in twentieth-century corporate strategy.
What Does BCG Stand For?
BCG stands for:
Boston Consulting Group.
The framework is therefore sometimes called:
- BCG Matrix.
- Boston Consulting Group Matrix.
- Growth-Share Matrix.
- BCG Growth-Share Matrix.
- Product Portfolio Matrix.
What Are the Two Axes of the BCG Matrix?
The Matrix uses:
Vertical Axis
Market Growth Rate
Horizontal Axis
Relative Market Share
Understanding those two variables is more important than memorizing the animal names.
What Is Market Growth Rate?
Market growth rate measures how quickly the relevant market or category is expanding.
For example:
Market revenue last year:
EGP 1 billion
Market revenue this year:
EGP 1.2 billion
Growth:
20%
A simplified formula is:
Market Growth Rate =
(Current Market Size − Previous Market Size) ÷ Previous Market Size × 100
So:
(1.2B − 1B) ÷ 1B × 100
=
20%
The company operates in a market growing approximately 20%.
Why Does Market Growth Matter?
High-growth markets can create:
- New customer demand.
- Expansion opportunities.
- Future revenue potential.
But they may also require substantial investment in:
- Capacity.
- Product.
- Sales.
- Distribution.
- Marketing.
- Technology.
Growth consumes resources.
That was fundamental to the original BCG logic.
A rapidly growing business may look impressive while consuming more cash than it produces.
High Growth Does Not Automatically Mean Attractive
A market can grow quickly while being:
- Unprofitable.
- Intensely competitive.
- Highly regulated.
- Expensive to enter.
- Difficult to defend.
For example:
A market growing at:
40% annually
sounds attractive.
But if:
- CAC is enormous.
- Margins are weak.
- Customer churn is high.
- Three global leaders dominate.
the opportunity may still be poor.
That is one major reason modern companies should not use growth rate alone.
What Is Relative Market Share?
Relative market share compares the company’s market share with the market share of its largest relevant competitor.
A common formula is:
Relative Market Share = Your Market Share ÷ Largest Competitor’s Market Share
Example:
Your company:
30% market share
Largest competitor:
20%
Relative Market Share:
30 ÷ 20 = 1.5
A relative share above:
1.0
means the company is larger than its largest competitor according to that measure.
Relative Market Share Example
Suppose:
Company A
40% market share.
Company B
25%.
Company C
20%.
Others
15%.
If Company A builds the BCG Matrix:
40 ÷ 25 = 1.6
Relative Market Share:
1.6
Company A holds a stronger relative competitive position.
Now consider Company C.
Its largest competitor is Company A.
20 ÷ 40 = 0.5
Relative Market Share:
0.5
It has half the share of the market leader.
Why Use Relative Market Share Instead of Market Share Alone?
Imagine:
Company A owns:
15% of a fragmented market.
Largest competitor:
10%.
That 15% may represent a leadership position.
Now imagine another market where Company B owns:
30%.
But the largest competitor owns:
60%.
Despite having twice Company A’s absolute share, Company B has a weaker relative position.
Relative share provides additional competitive context.
Why Was Market Share Important to the Original BCG Model?
The original logic connected strong relative market share with potential advantages from:
- Scale.
- Experience.
- Cost efficiency.
Henderson’s portfolio theory was closely related to BCG’s thinking around the experience curve.
The idea was that market leaders could potentially develop structural cost advantages competitors would find difficult to replicate.
Modern markets can behave differently.
Technology, platforms, network effects, asset-light businesses and rapidly shifting categories can complicate that relationship.
But competitive position remains an important strategic variable.
1. Stars in the BCG Matrix
Star = High Market Growth + High Relative Market Share
Stars operate in attractive growing markets while holding a strong competitive position.
They can represent the future of the business.
But Stars frequently require significant investment.
Why?
Because keeping leadership in a rapidly growing market may require:
- Product development.
- Marketing.
- Hiring.
- Capacity.
- Distribution.
- Technology.
- Sales.
BCG’s own description recommends significant investment in Stars because of their future potential.
Star Example
Imagine an Egyptian software company.
Its AI-enabled ERP product operates in a market growing:
30% annually.
The company’s share:
35%.
Largest competitor:
20%.
Relative share:
1.75
The Product has:
High Growth
High Relative Share
It could be classified as a Star.
What Should a Company Do With a Star?
Potential strategy:
Invest
Protect and strengthen leadership.
Build Brand
Make the leadership position defensible.
Improve Product
Prevent competitors from closing the gap.
Expand Distribution
Capture market growth.
Build Customer Loyalty
Reduce switching.
Strengthen Economics
Turn market leadership into sustainable cash generation.
The objective is often:
Maintain the Star’s leadership as the market matures.
Can a Star Become a Cash Cow?
Yes.
That is one of the classic success paths in the BCG Matrix.
Imagine:
High-growth market.
↓
Business becomes leader.
↓
Market eventually matures.
↓
Growth slows.
↓
Business retains strong relative share.
Now:
High Share + Low Growth
=
Cash Cow
The Star has matured into a major cash generator.
This is one of the ideal portfolio transitions.
Can a Star Fail?
Absolutely.
A Star can lose:
- Innovation leadership.
- Distribution.
- Customer preference.
- Market share.
Then as the market develops, it could become weaker.
This is why:
Star
does not mean:
guaranteed success.
Strong positions need defending.
Star Marketing Strategy
Marketing for a Star may emphasize:
- Category leadership.
- Customer acquisition.
- Brand building.
- Product education.
- Distribution.
- Differentiation.
- Retention.
Because the market itself is growing, the objective may be:
Capture a disproportionate share of new demand.
This can justify substantial investment.
2. Cash Cows in the BCG Matrix
Cash Cow = High Relative Market Share + Low Market Growth
Cash Cows have strong competitive positions within more mature markets.
They often generate more cash than they require for continued growth.
This makes them extremely important.
BCG’s original portfolio logic was that Cash Cows can provide resources that finance:
- Stars.
- Promising Question Marks.
- New strategic initiatives.
Cash Cow Example
Imagine a mature accounting software product.
Market growth:
3% annually
Company share:
50%
Largest competitor:
20%
Relative share:
2.5
The market is no longer expanding rapidly.
But the company has strong leadership.
This could be a Cash Cow.
What Should a Company Do With a Cash Cow?
Classic strategy often emphasizes:
Protect
Maintain market leadership.
Optimize
Improve efficiency.
Retain Customers
Defend the recurring revenue base.
Manage Costs
Avoid unnecessary investment.
Generate Cash
Use surplus resources intelligently elsewhere.
The mistake would be:
Ignore it because it is not exciting.
Cash Cows can fund the rest of the portfolio.
Cash Cow Does Not Mean “Stop Marketing”
This is an important misconception.
Suppose management says:
This is already a Cash Cow. Cut marketing completely.
Competitors may respond.
Market share begins falling.
Customer loyalty weakens.
The company slowly destroys the asset generating its cash.
Cash Cow strategy usually means:
Invest appropriately, not excessively.
Protect what produces value.
Cash Cow Marketing Strategy
Marketing may focus on:
- Retention.
- Loyalty.
- Brand reinforcement.
- Efficient acquisition.
- Cross-sell.
- Customer experience.
- Defensive search visibility.
- Competitor monitoring.
The objective is not necessarily explosive growth.
It may be:
maximize sustainable profitability while defending leadership.
Cash Cow and Pricing
Cash Cows sometimes create pricing opportunities because:
- Brand is established.
- Customer base is large.
- Category is mature.
But management should understand:
- Price elasticity.
- Competitors.
- Switching costs.
- Customer value.
before extracting more margin.
Short-term harvesting can damage long-term customer economics.
Cash Cow Example: Agency
Imagine a mature agency service:
Social Media Management
with:
- Strong client demand.
- Established workflows.
- High retention.
- Good margins.
The market may be mature relative to a newer capability such as AI automation.
That Social Media service may behave commercially like a Cash Cow.
Management may use its predictable revenue to finance newer services.
Cash Cow Example: FMCG
A long-established household product may have:
- High category share.
- Stable demand.
- Slow category growth.
The Product may not receive the excitement of new launches.
But it can still generate enormous cash.
Portfolio management prevents management fashion from destroying strong mature businesses.
3. Question Marks in the BCG Matrix
Question Mark = High Market Growth + Low Relative Market Share
Question Marks operate inside attractive growing markets.
But the company does not yet hold a strong position.
They are called Question Marks because management faces a difficult decision:
Should we invest aggressively enough to become a leader?
or:
Should we stop consuming resources before losses become larger?
BCG identifies Question Marks as businesses that may deserve investment if they have a credible path to becoming Stars—or may need to be exited if they do not.
Question Mark Example
Imagine a company launching:
Marketing automation software.
Market growth:
35%
Company share:
5%
Market leader:
40%
Relative Market Share:
5 ÷ 40 = 0.125
The market is attractive.
The company’s position is weak.
Question Mark.
Question Marks Can Consume Enormous Cash
High-growth markets often require major spending.
But because the company has weak share, it may also face:
- Lower brand recognition.
- Weaker distribution.
- Higher CAC.
- Fewer economies of scale.
- Strong competitors.
This combination can produce a dangerous situation:
An exciting Product that continuously consumes investment without gaining leadership.
Management needs evidence.
Not optimism.
Questions to Ask About a Question Mark
Is the Market Really Attractive?
Validate demand and economics.
Why Is Our Share Low?
Is the problem:
- Product?
- Positioning?
- Distribution?
- Awareness?
- Price?
- Competition?
Can We Become a Leader?
What investment would be required?
How Long Will It Take?
One year?
Five years?
What Happens if We Fail?
Define downside.
What Is the Opportunity Cost?
Could the capital perform better elsewhere?
These are portfolio decisions.
Question Mark Strategy
Potential choices include:
Invest
When there is a credible path to leadership.
Focus
Narrow the target segment.
Reposition
Create stronger differentiation.
Partner
Gain distribution or capability.
Sell
Another owner may create more value.
Exit
Stop consuming capital.
There is no universal answer.
That uncertainty is why the quadrant has its name.
Question Mark Example: Market Expansion
Suppose an Egyptian company enters Saudi Arabia.
The category is growing strongly.
But the company has:
- Low local awareness.
- Low market share.
- Limited sales coverage.
The Saudi business might initially behave like a Question Mark.
Leadership should determine:
Do we have enough evidence to invest toward leadership?
This is where Market Research and Go-to-Market planning become important.
Question Mark Marketing Strategy
If management chooses to invest:
Marketing may need to be aggressive.
Potential priorities:
- Positioning.
- Awareness.
- Product education.
- Sales enablement.
- Paid acquisition.
- Partnerships.
- SEO.
- PR.
- Distribution.
But:
Spend more
is not enough.
The business must understand what will convert investment into market share.
Question Mark to Star
This is the desired path.
Question Mark
↓
Investment
↓
Improved Product / Distribution / Brand
↓
Market Share Growth
↓
Star
But many Question Marks never become Stars.
That is why portfolio discipline matters.
4. Dogs in the BCG Matrix
Dog = Low Relative Market Share + Low Market Growth
Dogs occupy weak competitive positions within slow-growing markets.
The original BCG logic often treated these businesses as candidates for:
- Divestment.
- Liquidation.
- Repositioning.
They may consume management attention and resources without providing sufficient growth or cash.
But modern managers should avoid an automatic rule:
Dog = kill it.
That can be strategically naive.
Dog Example
Suppose a company sells legacy desktop software.
Market growth:
−5%
Company share:
8%
Market leader:
50%
Relative share:
0.16
Low share.
Low/negative growth.
The Product may qualify as a Dog.
Why Might a Dog Still Matter?
A low-growth, low-share Product may still:
Serve Important Customers
Customers buy it together with another Product.
Protect a Larger Relationship
It may be required for enterprise contracts.
Generate Positive Cash Flow
Low growth does not automatically mean unprofitable.
Provide Strategic Capability
Technology or expertise may support another business.
Serve a Profitable Niche
The total market may be small but attractive.
That is why decisions should include economics and strategic relationships.
Dog Strategies
Potential options include:
Harvest
Reduce investment while extracting remaining cash.
Reposition
Find a better segment or use case.
Niche
Focus on a narrow profitable market.
Bundle
Use it to support stronger Products.
Sell
Transfer to a better strategic owner.
Discontinue
Remove it when value no longer justifies complexity.
The Matrix starts the conversation.
It does not decide the answer.
Dog Example: Marketing Service
Suppose an agency still offers a legacy service with:
- Very little demand.
- Low margins.
- Few clients.
- No strategic differentiation.
Management keeps it because:
We’ve always offered it.
BCG-style portfolio analysis may reveal:
- Staff time.
- Website space.
- Sales effort.
- Management complexity.
could be better used elsewhere.
That does not automatically mean remove it.
It means:
justify its continued existence.
The Four BCG Quadrants Compared
| Quadrant | Growth | Relative Share | Typical Strategic Question |
|---|---|---|---|
| Star | High | High | How much should we invest to protect leadership? |
| Cash Cow | Low | High | How do we protect and maximize sustainable cash generation? |
| Question Mark | High | Low | Should we invest enough to build leadership or exit? |
| Dog | Low | Low | Does this business still deserve resources? |
The Ideal BCG Portfolio
The original BCG logic emphasized balance.
A company needs businesses that:
Generate Cash
Cash Cows.
Consume Cash for Future Growth
Stars.
Offer New Growth Options
Selected Question Marks.
A portfolio consisting only of:
Cash Cows
could eventually decline because no future growth engines exist.
A portfolio consisting only of:
Stars and Question Marks
might create strong growth but severe cash requirements.
The objective is not:
Have only Stars.
It is:
Build a portfolio capable of funding current operations and future growth.
BCG Success Sequence
A classic successful pathway is:
Question Mark
↓
build share
↓
Star
↓
market matures
↓
Cash Cow
A company finds an attractive high-growth market.
Initially:
low share.
It invests successfully.
Becomes leader.
The market eventually matures.
The company retains leadership.
It becomes a Cash Cow.
That is the ideal portfolio lifecycle.
BCG Failure Sequence
An unsuccessful pathway may look like:
Question Mark
↓
investment fails to build share
↓
growth slows
↓
Dog
Or:
Star
↓
loses market share
↓
market matures
↓
Dog
This shows why timing matters.
Winning market share after market growth has already disappeared may create little value.
How to Build a BCG Matrix
A useful BCG exercise should use evidence.
Step 1: Define the Portfolio
Choose what you are evaluating:
- Products.
- Brands.
- Services.
- Business units.
- Geographic businesses.
Do not mix incomparable levels.
For example:
Bad:
- Entire Saudi business.
- One individual Product.
- One advertising campaign.
Those are different strategic units.
Step 2: Define the Relevant Market
This is extremely important.
A company can manipulate the answer unintentionally by defining the market too broadly or too narrowly.
For example:
Is the market:
Software?
Too broad.
Maybe:
CRM software for Egyptian mid-market real estate businesses.
The market definition changes:
- Growth.
- Market share.
- Competitors.
Therefore it changes the Matrix.
Step 3: Calculate Market Growth
Use reliable market data where possible.
Possible sources:
- Government data.
- Industry reports.
- Company research.
- Market studies.
Calculate:
Market Growth Rate
for each relevant category.
Step 4: Estimate Market Share
Calculate the company’s share.
A revenue-based approach:
Company Category Revenue ÷ Total Market Revenue
Example:
Company:
EGP 200M.
Market:
EGP 1B.
Share:
20%
Step 5: Identify the Largest Competitor
Estimate the largest competitor’s share.
Suppose:
30%.
Step 6: Calculate Relative Market Share
20 ÷ 30 = 0.67
Relative Market Share:
0.67
The business is smaller than the market leader.
Step 7: Plot Each Business
Place it according to:
- Growth.
- Relative share.
Optionally:
Use bubble size to represent:
- Revenue.
- Assets.
- Profit.
This creates more portfolio context.
Step 8: Add Economics
Now improve the classic Matrix by adding:
- Margin.
- Cash generation.
- CAC.
- Retention.
- ROI.
- Capital needs.
Because two Products can occupy the same quadrant while having completely different economics.
Step 9: Add Strategic Role
Ask:
- Does this Product support another?
- Does it protect a key customer?
- Does it create data?
- Does it build the brand?
- Does it create strategic capability?
Not everything valuable appears in market share.
Step 10: Make Resource Decisions
For each Product decide:
- Invest.
- Maintain.
- Harvest.
- Reposition.
- Sell.
- Exit.
Now the Matrix becomes actionable.
Relative Market Share Formula
The formula deserves special attention.
Relative Market Share =
Your Market Share ÷ Largest Competitor Market Share
Example A:
Your share:
40%.
Largest competitor:
25%.
40 ÷ 25 = 1.6
Strong relative share.
Example B:
Your share:
15%.
Largest competitor:
50%.
15 ÷ 50 = 0.3
Weak relative share.
What Is “High” Relative Market Share?
In a simplified interpretation:
1.0
can be a meaningful reference point because it represents parity with the largest competitor.
Above 1:
You are larger.
Below 1:
The competitor is larger.
But companies should not use this mechanically.
Market structures vary dramatically.
A fragmented market may behave differently from a category with one dominant platform.
What Is a High Market Growth Rate?
There is no universally correct growth-rate threshold for every BCG Matrix.
Some textbook examples use fixed cutoffs.
A better strategic approach is to consider:
- Industry growth.
- Economic growth.
- Portfolio growth.
- Historical category growth.
- Management’s investment hurdle.
A:
10% growth rate
could be excellent in one industry.
Weak in another.
Use a threshold appropriate to the category.
BCG Matrix Example: SaaS Company
Imagine a SaaS company with four Products.
Product A — AI CRM
Market growth:
30%.
Relative market share:
1.5.
Star
Product B — Core Accounting Platform
Market growth:
4%.
Relative market share:
2.2.
Cash Cow
Product C — Marketing Automation
Market growth:
25%.
Relative market share:
0.25.
Question Mark
Product D — Legacy Desktop Software
Market growth:
−5%.
Relative market share:
0.2.
Dog
Now management can ask:
AI CRM
How much should we invest to defend leadership?
Accounting Platform
How do we protect cash generation?
Marketing Automation
Do we have a realistic path to leadership?
Legacy Software
Should we maintain, migrate customers or discontinue?
That is the value of portfolio thinking.
BCG Matrix Example: Marketing Agency
Imagine a full-service agency portfolio.
Performance Marketing
High category growth.
Strong market position.
Could behave like:
Star
Established Social Media Service
Mature market.
Strong customer base.
Could behave like:
Cash Cow
Revenue Operations Consulting
Fast-growing strategic area.
Low current market share.
Could behave like:
Question Mark
Low-Demand Legacy Service
Slow category.
Weak agency position.
Could behave like:
Dog
This does not mean those exact classifications apply to Udjat.
The example illustrates how agencies can use portfolio logic for services rather than only physical Products.
BCG Matrix Example: Restaurant Group
A restaurant group operates four concepts.
Fast-Growing Premium Concept
High market share.
Star
Established Family Restaurant
High share.
Mature category.
Cash Cow
New Healthy-Food Concept
High-growth category.
Low share.
Question Mark
Old Declining Concept
Low growth.
Low share.
Dog
Capital allocation can then differ by concept.
BCG Matrix Example: eCommerce Business
A retailer may classify categories rather than businesses.
For example:
Skincare
High growth + high relative share.
Star.
Basic Personal Care
Mature + high share.
Cash Cow.
Supplements
High growth + weak share.
Question Mark.
Legacy Electronics Accessories
Slow growth + weak share.
Dog.
The business can change:
- Inventory.
- Advertising.
- Website prominence.
- Procurement.
according to portfolio strategy.
BCG Matrix Example: Real Estate Developer
A developer might analyze:
- Residential.
- Commercial.
- Coastal.
- Hospitality.
But Market definition matters enormously.
If all projects compete in different:
- Geographies.
- Customer segments.
- Price categories.
they should not automatically share the same growth assumptions.
The BCG Matrix becomes useful only when each relevant market is clearly defined.
BCG Matrix Example: FMCG
A food manufacturer has four product categories.
Energy Drinks
High category growth.
Strong share.
Star.
Traditional Juice
Mature category.
Strong share.
Cash Cow.
Protein Beverages
Fast growth.
Low share.
Question Mark.
Legacy Powdered Drink
Declining market.
Low share.
Dog.
Marketing budgets should not automatically be allocated based on:
last year’s revenue.
Growth potential and competitive position matter too.
BCG Matrix for Small Businesses
A small company can simplify the model.
List every major:
- Product.
- Service.
- Branch.
- Category.
Then ask:
Market Growth
Is demand:
- Growing?
- Stable?
- Shrinking?
Competitive Position
Are we:
- Strong?
- Average?
- Weak?
Then classify.
The exercise may reveal that most resources are being spent on:
Products with weak future potential.
That can trigger better strategic discussions.
BCG Matrix for Startups
Early-stage startups need caution.
Reliable:
- Market share.
- Market size.
- Growth data.
may be difficult to establish.
And a startup may have only one Product.
The Matrix becomes more useful once the company has a genuine portfolio.
Startups with:
- Multiple Products.
- Customer segments.
- Geographic businesses.
can still use the logic.
But do not manufacture fake market-share precision from weak data.
BCG Matrix for B2B Businesses
B2B companies can classify:
- Product lines.
- Industries.
- Geographic divisions.
- Service lines.
Example:
An industrial company may analyze:
Packaging Machinery
Food Processing Machinery
Automation Systems
Maintenance Services
Each needs its own:
- Market definition.
- Market-growth data.
- Competitive share.
BCG Matrix for Service Companies
The framework applies beyond physical Products.
A consultancy could classify:
- Strategy.
- Technology.
- Research.
- Transformation.
An agency could classify:
- SEO.
- Performance.
- Branding.
- Development.
- AI services.
A law firm could classify practice areas.
Think:
business portfolio
rather than only:
Product portfolio.
BCG Matrix and Marketing Budget Allocation
This is one of the most valuable applications for Udjat’s audience.
Suppose a company has:
EGP 10 million marketing budget.
Should every Product receive:
EGP 2.5 million?
Probably not.
A better allocation may reflect:
- Growth potential.
- Market position.
- Profit margin.
- Strategic importance.
- CAC.
- Retention.
For example:
Star
May justify aggressive investment.
Cash Cow
Defend efficiently.
Question Mark
Fund selectively according to evidence.
Dog
Limit spending unless strategic reasons justify it.
Marketing budgets should follow portfolio strategy.
Not politics between departments.
BCG Matrix and Revenue
Revenue alone can be misleading.
Suppose:
Product A
Revenue:
EGP 100M.
Growth:
0%.
Product B
Revenue:
EGP 20M.
Growth:
50%.
Management could allocate almost everything to Product A because it is larger.
But Product B may represent the future.
Portfolio tools encourage management to balance:
today’s revenue
with:
tomorrow’s growth.
BCG Matrix and Profitability
The original Matrix does not directly include profitability as an axis.
That creates a limitation.
A Star may:
- Lose money.
A Dog may:
- Generate profit.
Therefore Udjat would add financial measures such as:
- Gross margin.
- Contribution margin.
- Cash generation.
- ROIC.
- CAC.
- LTV.
Do not confuse:
quadrant
with:
financial performance.
BCG Matrix and Customer Lifetime Value
For subscription and service businesses, LTV can add critical context.
Imagine two Question Marks.
Both:
- High-growth markets.
- Low share.
Question Mark A:
LTV = 6:1.
Question Mark B:
LTV = 1.2:1.
The BCG Matrix places both in the same quadrant.
Their investment attractiveness is completely different.
That illustrates why modern portfolio decisions need additional data.
BCG Matrix and Market Research
Reliable classification requires reliable market evidence.
Udjat’s Market Research approach can help estimate:
- Market size.
- Market growth.
- Competitor share.
- Category dynamics.
- Customer demand.
Without research, management may classify products according to internal opinions.
That defeats the purpose.
BCG Matrix and Marketing Strategy
Once the portfolio is classified, Marketing Strategy can differ by quadrant.
Star Strategy
Growth + leadership.
Cash Cow Strategy
Retention + efficiency + profitability.
Question Mark Strategy
Validation + focused share growth.
Dog Strategy
Efficiency + niche + repositioning or exit.
Different portfolio positions deserve different marketing objectives.
BCG Matrix and Ansoff Matrix
These frameworks work extremely well together.
The Ansoff Matrix asks:
Where should growth come from?
The BCG Matrix asks:
Where should resources go across the current portfolio?
Example:
BCG identifies a Cash Cow.
Its surplus funds could finance:
an Ansoff:
Product Development
or:
Market Development
strategy.
So:
BCG
Portfolio resource allocation.
↓
Ansoff
Growth direction.
↓
STP
Target customers.
↓
Marketing Mix
Execution.
BCG Matrix vs Ansoff Matrix
| BCG Matrix | Ansoff Matrix |
|---|---|
| Portfolio management | Growth strategy |
| Existing businesses/products | Existing + new growth options |
| Market Growth | Product/Market direction |
| Relative Market Share | Existing/New Products |
| Allocate resources | Identify growth route |
| Stars/Cows/Questions/Dogs | Penetration/Development/Diversification |
They are complementary.
Not substitutes.
BCG Matrix and STP Marketing
Suppose the BCG Matrix identifies a promising Question Mark.
The next challenge is:
How do we gain share?
STP Marketing helps determine:
Segmentation
Which customer groups exist?
Targeting
Which deserve priority?
Positioning
Why should they choose us?
BCG tells you:
This Product might deserve investment.
STP helps determine:
How to compete more intelligently.
BCG Matrix and Marketing 4Ps
Once strategy is clear, the Marketing 4Ps can align:
- Product.
- Price.
- Place.
- Promotion.
For a Question Mark:
Product
What needs improvement?
Price
Does pricing create value?
Place
Is distribution limiting share?
Promotion
Do customers know us?
The BCG classification can trigger a deeper marketing diagnosis.
BCG Matrix and 7Ps Marketing
Service businesses can extend the diagnosis using the 7Ps Marketing framework.
A service may have weak share because of:
- People.
- Process.
- Physical Evidence.
Not Promotion.
For example:
The agency advertises heavily.
But:
- Sales response is poor.
- Onboarding is confusing.
- Case-study evidence is weak.
Increasing media spend will not necessarily turn the Question Mark into a Star.
BCG Matrix and SOSTAC
SOSTAC can convert the portfolio decision into a marketing plan.
Example:
Situation
Product is a Question Mark.
Objective
Increase relative share from:
0.3
to:
0.7.
Strategy
Target high-value underserved customer segment.
Tactics
SEO + paid search + partnerships.
Action
Assign budget and owners.
Control
Measure:
- Market share.
- Pipeline.
- CAC.
- Revenue.
The frameworks now become executable.
BCG Matrix and Product Marketing
Question Marks and Stars frequently require strong Product Marketing.
Product Marketing can support:
- Customer research.
- Positioning.
- Messaging.
- Competitive intelligence.
- Pricing.
- Sales enablement.
A weak relative share may exist because:
the market does not understand why the Product matters.
Portfolio analysis alone cannot solve that.
BCG Matrix and Go-to-Market Strategy
A Question Mark may require a new GTM strategy.
For example:
Strong Product.
High-growth market.
Low share.
Why?
Perhaps:
- Wrong segment.
- Weak distribution.
- Poor positioning.
- Wrong sales model.
A Go-to-Market Strategy can diagnose how the company competes and reaches buyers.
BCG Matrix and Revenue Operations
A BCG portfolio can also inform Revenue Operations.
Different Products may have different:
- Sales cycles.
- CAC.
- Win rates.
- Expansion.
- Retention.
Portfolio management improves when marketing data connects with:
CRM
↓
Pipeline
↓
Won Revenue
↓
Retention
rather than relying on promotional metrics.
BCG Matrix vs SWOT Analysis
SWOT asks:
What internal and external strategic factors matter?
BCG asks:
How should the portfolio be prioritized?
SWOT can therefore support the analysis behind each BCG unit.
Example:
Question Mark:
Strength
Excellent technology.
Weakness
Low awareness.
Opportunity
Fast-growing market.
Threat
Dominant global competitor.
Now management better understands why the Question Mark exists.
BCG Matrix vs Porter’s Five Forces
Porter’s Five Forces examines:
How structurally attractive and competitive is the industry?
BCG uses:
Market Growth + Relative Market Share.
Five Forces adds deeper questions about:
- Rivalry.
- New entrants.
- Substitutes.
- Supplier power.
- Buyer power.
This is useful because a:
high-growth market
can still be:
structurally unattractive.
The two frameworks can complement each other.
BCG Matrix vs GE-McKinsey Matrix
The BCG Matrix is deliberately simple.
Two dimensions:
- Growth.
- Share.
The GE-McKinsey Matrix uses broader concepts:
- Industry attractiveness.
- Business-unit competitive strength.
with multiple underlying criteria.
That can create a richer analysis.
But also more complexity.
Use BCG when management needs:
clarity quickly.
Use more detailed portfolio models when decisions justify additional complexity.
BCG Matrix vs Product Lifecycle
The Product Lifecycle typically considers stages such as:
- Introduction.
- Growth.
- Maturity.
- Decline.
There are conceptual similarities.
For example:
A successful Star may eventually become a Cash Cow as category growth slows.
But the frameworks are not identical.
Product Lifecycle focuses more directly on:
market/product maturity over time.
BCG combines:
market growth
with:
competitive share.
A Product in a growing lifecycle stage could still be a Question Mark if its relative share is weak.
Advantages of the BCG Matrix
1. Easy to Understand
Executives can understand the structure quickly.
2. Forces Portfolio Thinking
Management stops evaluating every business independently.
3. Encourages Resource Allocation
The model asks:
Where should capital go?
4. Balances Today and Tomorrow
Cash Cows fund future opportunities.
5. Creates Strategic Questions
Especially around Question Marks.
6. Highlights Competitive Position
Growth alone is not enough.
7. Supports Marketing Prioritization
Different Products require different objectives.
Its simplicity is its greatest strength.
And also one of its biggest limitations.
Limitations of the BCG Matrix
The Matrix should not be treated as a complete strategy.
Limitation 1: Only Two Dimensions
Real business attractiveness depends on much more than:
- Growth.
- Share.
Also consider:
- Margin.
- Regulation.
- Competition.
- Customer loyalty.
- Technology.
Limitation 2: Market Definition Is Subjective
Change the market definition and:
- Market growth.
- Market share.
may change dramatically.
Limitation 3: Market Share Does Not Guarantee Profitability
A high-share business can lose money.
Limitation 4: Growth Does Not Guarantee Attractiveness
High-growth markets can destroy capital.
Limitation 5: Dogs Can Still Be Valuable
Some low-growth businesses:
- Generate cash.
- Support customers.
- Provide strategic capability.
Limitation 6: Synergies Are Underrepresented
One Product may help sell another.
The Matrix treats units more independently.
Limitation 7: Static Snapshot
Markets change continuously.
A BCG Matrix should be reviewed over time.
Limitation 8: Share Can Be Hard to Measure
Especially in:
- Private markets.
- Services.
- Fragmented industries.
Use honest uncertainty.
Limitation 9: Modern Digital Economics Can Differ
Network effects, SaaS economics and platform businesses do not always follow classic experience-curve assumptions neatly.
Limitation 10: It Can Encourage Oversimplified Decisions
Dog? Kill it.
Star? Spend everything.
That is not strategic management.
The Matrix should create questions.
Not slogans.
Is the BCG Matrix Still Relevant?
Yes—as a portfolio-thinking tool.
BCG itself revisited the framework decades after its creation and argued that it remains useful, while acknowledging that modern business environments require adaptation.
Its continued value comes from the fundamental management problem it addresses:
Companies have limited resources and multiple opportunities.
That problem has not disappeared.
What has changed is the amount of additional evidence available.
A modern BCG Matrix should therefore be supplemented with:
- Customer economics.
- Market research.
- Competitive analysis.
- Financial returns.
- Strategic fit.
- Technology.
- Risk.
Use the framework.
Do not worship it.
A Modern BCG Matrix
Udjat would extend the classic model.
Start with:
Market Growth
Relative Market Share
Then overlay:
Revenue
How large is the business?
Profit
Does it actually create value?
CAC
What does growth cost?
LTV
What is the customer worth?
Retention
Is revenue durable?
Strategic Fit
Does the business support company direction?
Competitive Advantage
Can the position be defended?
Investment Required
What capital is needed?
This creates better resource decisions.
BCG Investment Scorecard
After plotting the Matrix, score each business.
| Factor | Weight |
|---|---|
| Market Growth | 15% |
| Relative Market Share | 15% |
| Profitability | 15% |
| Customer Economics | 15% |
| Competitive Advantage | 15% |
| Strategic Fit | 10% |
| Cash Generation | 10% |
| Execution Risk | 5% |
Example:
| Business | Score |
|---|---|
| Product A | 86/100 |
| Product B | 78/100 |
| Product C | 64/100 |
| Product D | 41/100 |
This does not make the answer scientifically objective.
It makes management assumptions explicit.
Complete BCG Matrix Template
Use this in a management workshop.
Business / Product 1
Name:
Market:
Market Growth:
Our Market Share:
Largest Competitor Share:
Relative Market Share:
BCG Quadrant:
Revenue:
Margin:
Cash Generation:
Strategic Role:
Recommended Investment:
Repeat for every major business unit.
BCG Strategy Template
For each quadrant:
Stars
Which Stars deserve continued investment?
____________________________
What could threaten leadership?
____________________________
Cash Cows
Which businesses generate excess cash?
____________________________
How do we protect them?
____________________________
Question Marks
Which deserve investment?
____________________________
Which lack a credible path to leadership?
____________________________
Dogs
Which remain strategically useful?
____________________________
Which should be repositioned, harvested or exited?
____________________________
BCG Portfolio Audit
Ask:
| Question | Clear? |
|---|---|
| Have we defined each relevant market properly? | |
| Do we know market growth? | |
| Do we know our approximate share? | |
| Do we know the largest competitor’s share? | |
| Have we calculated relative share? | |
| Which Products are Stars? | |
| Which are Cash Cows? | |
| Which are Question Marks? | |
| Which are Dogs? | |
| Do we know profit by Product? | |
| Do we know cash generation? | |
| Do we know customer economics? | |
| Do we know which Question Marks can realistically become Stars? | |
| Do we understand portfolio synergies? | |
| Does marketing budget reflect portfolio strategy? | |
| Is capital being trapped in weak businesses? | |
| Do current Cash Cows fund future growth? |
If management cannot answer:
Where should the next EGP 10 million go?
the portfolio strategy may need more work.
Common BCG Matrix Mistakes
Mistake 1: Using Revenue Instead of Market Share
Large revenue does not necessarily mean strong relative share.
Mistake 2: Using Absolute Share Instead of Relative Share
The model specifically emphasizes competitive position relative to the leading competitor.
Mistake 3: Defining Markets Poorly
This can invalidate the whole analysis.
Mistake 4: Assuming Star Means Profitable
Stars can consume large amounts of cash.
Mistake 5: Assuming Cash Cow Means Ignore
Leadership still needs protecting.
Mistake 6: Funding Every Question Mark
Some will never become Stars.
Mistake 7: Automatically Killing Dogs
Understand strategic value first.
Mistake 8: Ignoring Economics
Quadrant does not equal profitability.
Mistake 9: Using Outdated Data
The Matrix is a snapshot.
Mistake 10: Treating BCG as the Entire Strategy
Use additional evidence and frameworks.
How Udjat Can Apply the BCG Matrix
Udjat can connect portfolio analysis with actual growth decisions.
Step 1 — Market Research
Measure:
- Category.
- Growth.
- Competition.
- Share.
Step 2 — BCG Portfolio Analysis
Classify:
- Stars.
- Cash Cows.
- Question Marks.
- Dogs.
Step 3 — Economics
Evaluate:
- Revenue.
- Margin.
- CAC.
- Retention.
- LTV.
Step 4 — Strategic Choice
Decide:
- Invest.
- Defend.
- Validate.
- Reposition.
- Harvest.
- Exit.
Step 5 — Growth Direction
Use the Ansoff Matrix if additional growth is required.
Step 6 — Customer Strategy
Use STP.
Step 7 — Marketing Strategy
Define:
- Objectives.
- Channels.
- Budget.
- Customer journey.
Step 8 — Execution
Connect:
- SEO.
- Paid media.
- Social.
- Sales.
- CRO.
Step 9 — Measurement
Track whether increased investment actually creates:
Share + Profit + Revenue.
The result is:
Portfolio Evidence
↓
Capital Allocation
↓
Marketing Allocation
↓
Commercial Outcomes
rather than:
Every department gets last year’s budget plus 10%.
BCG Matrix Quick Facts
BCG stands for Boston Consulting Group.
The BCG Matrix is also called the Growth-Share Matrix.
It was developed at BCG in the late 1960s and popularized by Bruce Henderson’s 1970 Product Portfolio essay.
The two traditional dimensions are market growth and relative market share.
Stars = high growth + high share.
Cash Cows = low growth + high share.
Question Marks = high growth + low share.
Dogs = low growth + low share.
Relative Market Share can be calculated by dividing your market share by the share of the largest competitor.
Stars can eventually become Cash Cows when markets mature and leadership is maintained.
Question Marks can become Stars—or fail and eventually become Dogs.
Cash Cows can finance investment in future growth opportunities.
Dogs should be evaluated strategically rather than automatically eliminated.
The Matrix is a portfolio-management framework, not a complete financial or marketing strategy.
Frequently Asked Questions About the BCG Matrix
What is the BCG Matrix?
The BCG Matrix is a portfolio-management framework that classifies businesses or Products using market growth and relative market share.
What does BCG stand for?
BCG stands for:
Boston Consulting Group.
What is another name for the BCG Matrix?
The framework is also called:
- Growth-Share Matrix.
- BCG Growth-Share Matrix.
- Product Portfolio Matrix.
Who created the BCG Matrix?
The framework was developed collaboratively at Boston Consulting Group in the late 1960s.
BCG credits Alan Zakon with an early sketch of the model and founder Bruce Henderson with popularizing it through his 1970 essay The Product Portfolio.
What are the four categories of the BCG Matrix?
The four categories are:
- Stars.
- Cash Cows.
- Question Marks.
- Dogs.
What is a Star in the BCG Matrix?
A Star has:
High Market Growth
and:
High Relative Market Share.
Stars often deserve substantial investment to maintain leadership.
What is a Cash Cow?
A Cash Cow has:
High Relative Market Share
in:
a lower-growth market.
Cash Cows typically generate funds that can support other investments.
What is a Question Mark?
A Question Mark has:
Low Relative Market Share
in:
a high-growth market.
Management must determine whether additional investment can realistically create leadership.
What is a Dog in the BCG Matrix?
A Dog has:
Low Relative Market Share
and:
Low Market Growth.
It may deserve harvesting, repositioning, divestment or exit depending on profitability and strategic importance.
Should all Dogs be eliminated?
No.
A Dog can still:
- Generate profit.
- Support another Product.
- Serve strategic customers.
- Occupy a useful niche.
Evaluate economics and strategic role before deciding.
What are the two axes of the BCG Matrix?
The traditional axes are:
- Market Growth Rate.
- Relative Market Share.
How do you calculate relative market share?
A common formula is:
Your Market Share ÷ Largest Competitor’s Market Share
If you have:
30%
and the competitor has:
20%,
relative share equals:
1.5.
What does relative market share above 1 mean?
It generally means your share exceeds that of the largest competitor used for comparison.
What is market growth rate?
Market growth rate measures how quickly the relevant market expands or contracts over a defined period.
What is a good market growth rate for the BCG Matrix?
There is no universal threshold appropriate for every category.
Compare growth with:
- Industry norms.
- Historical growth.
- Economic environment.
- Portfolio expectations.
Can a Star become a Cash Cow?
Yes.
If market growth slows while the business maintains high relative share, a Star can become a Cash Cow.
Can a Question Mark become a Star?
Yes.
If the company successfully increases relative market share while the market continues growing.
Can a Question Mark become a Dog?
Yes.
If the company remains weak and market growth later slows.
Can a Cash Cow become a Dog?
Yes.
If the business loses its strong market position while growth remains low.
Are Stars always profitable?
No.
Stars can require substantial investment and may consume cash despite their strong position.
Are Cash Cows always the most profitable Products?
Not necessarily.
The name describes their traditional portfolio role rather than guaranteeing specific accounting profitability.
What is the objective of the BCG Matrix?
Its primary purpose is to help management think about:
- Portfolio balance.
- Resource allocation.
- Investment priorities.
How is the BCG Matrix used in marketing?
It can help companies decide how marketing investment should differ across Products or business units.
Can BCG be used for services?
Yes.
Companies can classify:
- Service lines.
- Practices.
- Business units.
not only physical Products.
Can the BCG Matrix be used for brands?
Yes.
Multi-brand organizations can use the framework to evaluate different brands when meaningful market-share and growth data exists.
Can small businesses use the BCG Matrix?
Yes, particularly when they have several meaningful:
- Products.
- Services.
- Branches.
- Categories.
Can startups use the BCG Matrix?
Yes, but it becomes more useful when a startup has a true portfolio and sufficiently reliable market data.
What are the advantages of the BCG Matrix?
Advantages include:
- Simplicity.
- Portfolio visibility.
- Resource-allocation focus.
- Competitive context.
- Easy communication.
What are the disadvantages of the BCG Matrix?
Limitations include:
- Only two primary variables.
- Dependence on market definition.
- Lack of direct profitability analysis.
- Limited treatment of business synergies.
- Potential oversimplification.
Is the BCG Matrix outdated?
Not necessarily.
The framework still addresses the relevant management problem of allocating scarce resources among multiple businesses.
However, modern companies should supplement it with broader commercial and financial analysis.
Is BCG Matrix the same as Ansoff Matrix?
No.
The BCG Matrix evaluates the existing portfolio.
The Ansoff Matrix identifies Product-Market growth directions.
Which comes first: BCG or Ansoff?
There is no universal sequence.
One useful approach is:
BCG
understand the current portfolio.
↓
Ansoff
determine future growth options.
What is the difference between BCG and SWOT?
SWOT analyzes:
- Strengths.
- Weaknesses.
- Opportunities.
- Threats.
BCG analyzes portfolio position according to:
- Market growth.
- Relative market share.
What is the difference between BCG and Porter’s Five Forces?
BCG helps allocate resources across a portfolio.
Five Forces evaluates structural competitive attractiveness within an industry.
What is the difference between BCG and Product Lifecycle?
Product Lifecycle focuses on stages such as:
- Introduction.
- Growth.
- Maturity.
- Decline.
BCG combines market growth with competitive share.
How often should a BCG Matrix be updated?
Update it whenever material changes occur in:
- Market growth.
- Competition.
- Market share.
- Portfolio strategy.
For rapidly changing categories, review it more frequently.
What data is required for a BCG Matrix?
At minimum:
- Defined business unit/Product.
- Market definition.
- Market growth.
- Company market share.
- Largest competitor share.
For stronger analysis, add:
- Revenue.
- Margin.
- Cash flow.
- Customer economics.
- Strategic fit.
Can Udjat build a BCG portfolio analysis?
Yes.
Udjat can connect:
Market Research
↓
Portfolio Definition
↓
Market Growth
↓
Relative Share
↓
BCG Matrix
↓
Commercial Economics
↓
Investment Priorities
↓
Ansoff Growth Strategy
↓
Marketing Strategy
↓
Execution
The important output is not the four-quadrant graphic.
It is the resource decision management makes because of it.
How can I start a portfolio strategy project with Udjat?
Bring:
- Product/service portfolio.
- Revenue by Product.
- Margin by Product.
- Market estimates.
- Competitor data.
- Customer data.
- Current marketing investment.
- Product roadmap.
- Growth objectives.
Then meet Udjat Agency to determine where the business should defend leadership, fund growth, test opportunities or reconsider resource allocation.
Conclusion: Not Every Product Deserves the Same Investment
A company has:
EGP 20 million
available for growth.
Four business units ask for more budget.
Management could divide it equally.
EGP 5 million each.
That feels fair.
It may be strategically terrible.
One Product may be a:
Star
where another EGP 5 million strengthens future leadership.
Another may be a:
Cash Cow
that needs only enough investment to defend its position.
Another may be a:
Question Mark
requiring a clear proof point before receiving substantial capital.
Another may be a:
Dog
that management keeps funding because nobody wants to make the difficult decision.
That is the central lesson of the BCG Matrix:
Resources should not be allocated equally merely because businesses coexist inside the same company.
Instead ask:
How fast is the market growing?
↓
How strong is our competitive position?
↓
What are the economics?
↓
What strategic role does this business play?
↓
What could additional investment accomplish?
Then decide.
The classic portfolio becomes:
Stars
Invest intelligently for leadership.
Cash Cows
Protect and generate resources.
Question Marks
Choose carefully.
Dogs
Justify, reposition, harvest or reconsider.
But modern portfolio strategy should go further.
Combine:
BCG Matrix
with:
Market Research
Profitability
Customer Economics
Strategic Fit
Ansoff Matrix
Marketing Strategy
and the discussion evolves from:
Which Product do we like most?
to:
Where will the next pound of investment create the greatest strategic value?
That is the management question the BCG Matrix is ultimately designed to help answer.
If your business has several Products, brands, services or markets but budgets are still allocated mainly according to last year’s spending or internal politics, meet Udjat Agency.
Before deciding:
how much should we spend?
first determine:
which part of the portfolio deserves the investment.
Sources
- Boston Consulting Group — What Is the Growth Share Matrix?
https://www.bcg.com/about/overview/our-history/growth-share-matrix
BCG describes the framework’s history, the two underlying drivers of market growth and relative market share, and its four portfolio categories. - Bruce Henderson / Boston Consulting Group — The Product Portfolio (1970)
https://www.bcg.com/publications/1970/strategy-the-product-portfolio
Henderson’s original portfolio essay explains the relationship between growth, market share, cash requirements, Stars, Cash Cows and Question Marks. - Boston Consulting Group — BCG History
https://www.bcg.com/about/overview/our-history
Documents BCG’s historical development of strategy concepts including the Growth-Share Matrix. - OpenStax — Principles of Marketing: Strategic Planning and the BCG Matrix
https://openstax.org/books/principles-marketing/pages/2-2-the-role-of-marketing-in-the-strategic-planning-process
Explains Stars, Cash Cows, Question Marks and Dogs using market growth and relative market share. - Udjat Agency — Marketing Strategy Agency Egypt
https://www.udjatagency.com/services/marketing-strategy-agency-egypt/
Udjat connects market evidence, positioning, channel choices, customer journeys, KPIs and resource priorities around measurable business outcomes. - Udjat Agency — Market Research Company Egypt
https://www.udjatagency.com/market-research-company-egypt/
Supports portfolio decisions through market sizing, category research, competitor analysis, customer evidence, pricing and commercial research.